Analyzing miner-to-exchange flows is crucial for understanding market sentiment, particularly when evaluating whether miners are liquidating or accumulating. A surge in Bitcoin inflows to exchanges has historically preceded an increase in sell orders, often leading to price slumps as the selling pressure increases.
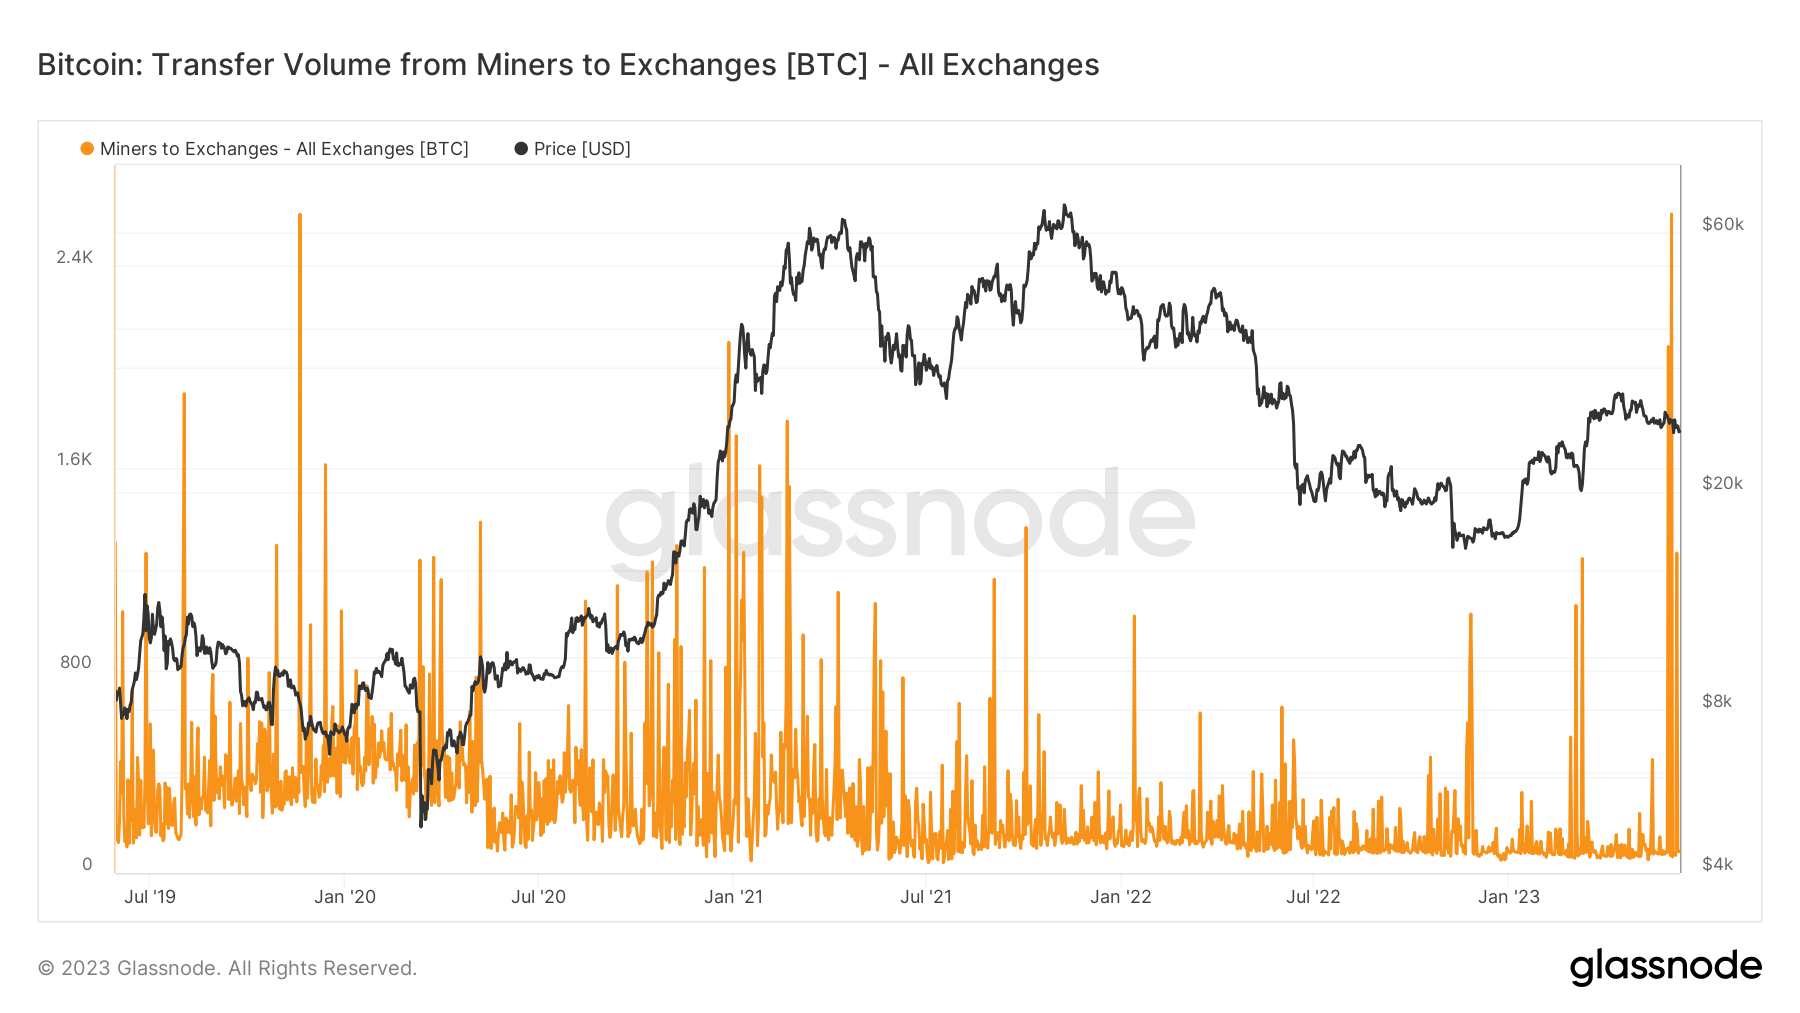
On June 3, miners transferred a considerable volume of BTC to exchanges, sparking market-wide debate about the source of these inflows and their potential impact on the market. Data from Glassnode showed that just over 2,606 BTC was transferred on June 3, making it the highest transfer since March 26, 2019. At the time, miners sent over 4,083 BTC to exchanges.

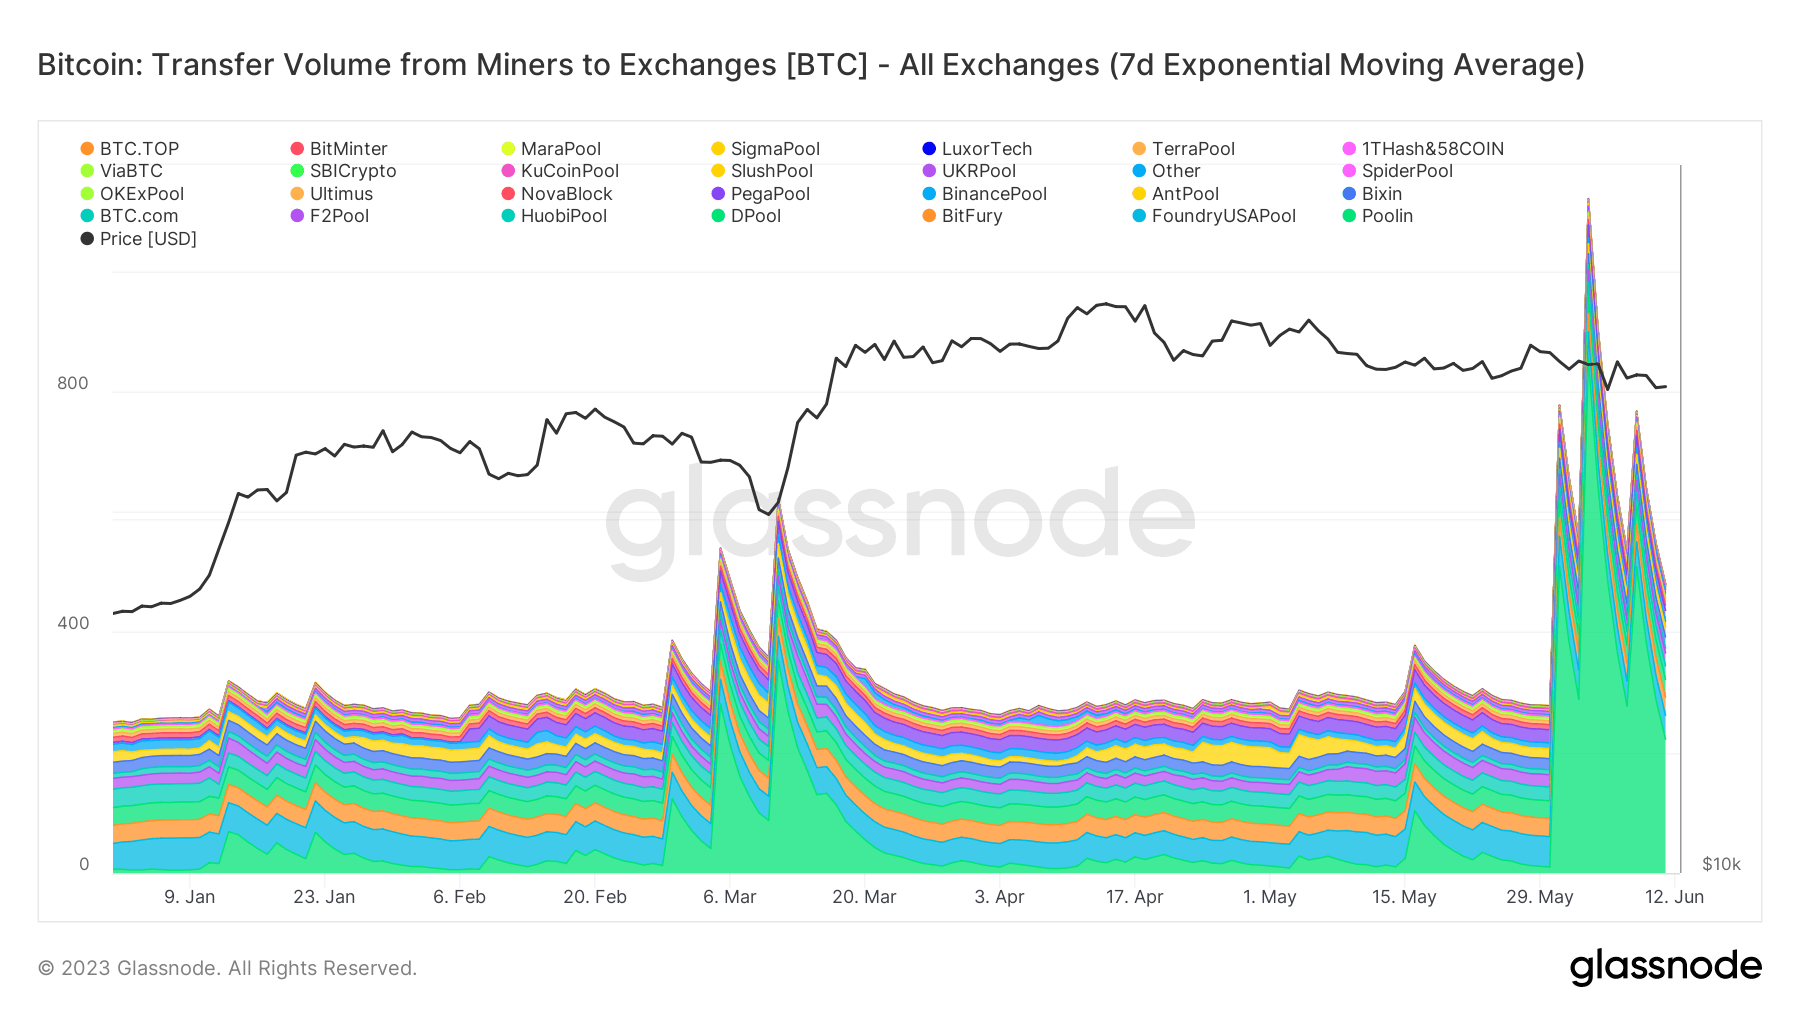
CryptoSlate analysis found that the main driver of the massive outflow was Poolin, one of the largest mining pools on the market. Approximately a third of all Bitcoin transferred from miners to exchanges on June 3 can be attributed to Poolin, as the pool transferred 853.4 BTC.
The transfer is not an isolated event — it is a continuation of a trend from Poolin that began in late May.
Since May 31, Poolin has sent an average of 433.5 BTC to exchanges each day, peaking with the large outflow on June 3. For comparison, the next largest contributor, Foundry USA, transferred 45.5 BTC on the same day and maintained a daily transfer volume between 40 and 50 BTC since the end of May.

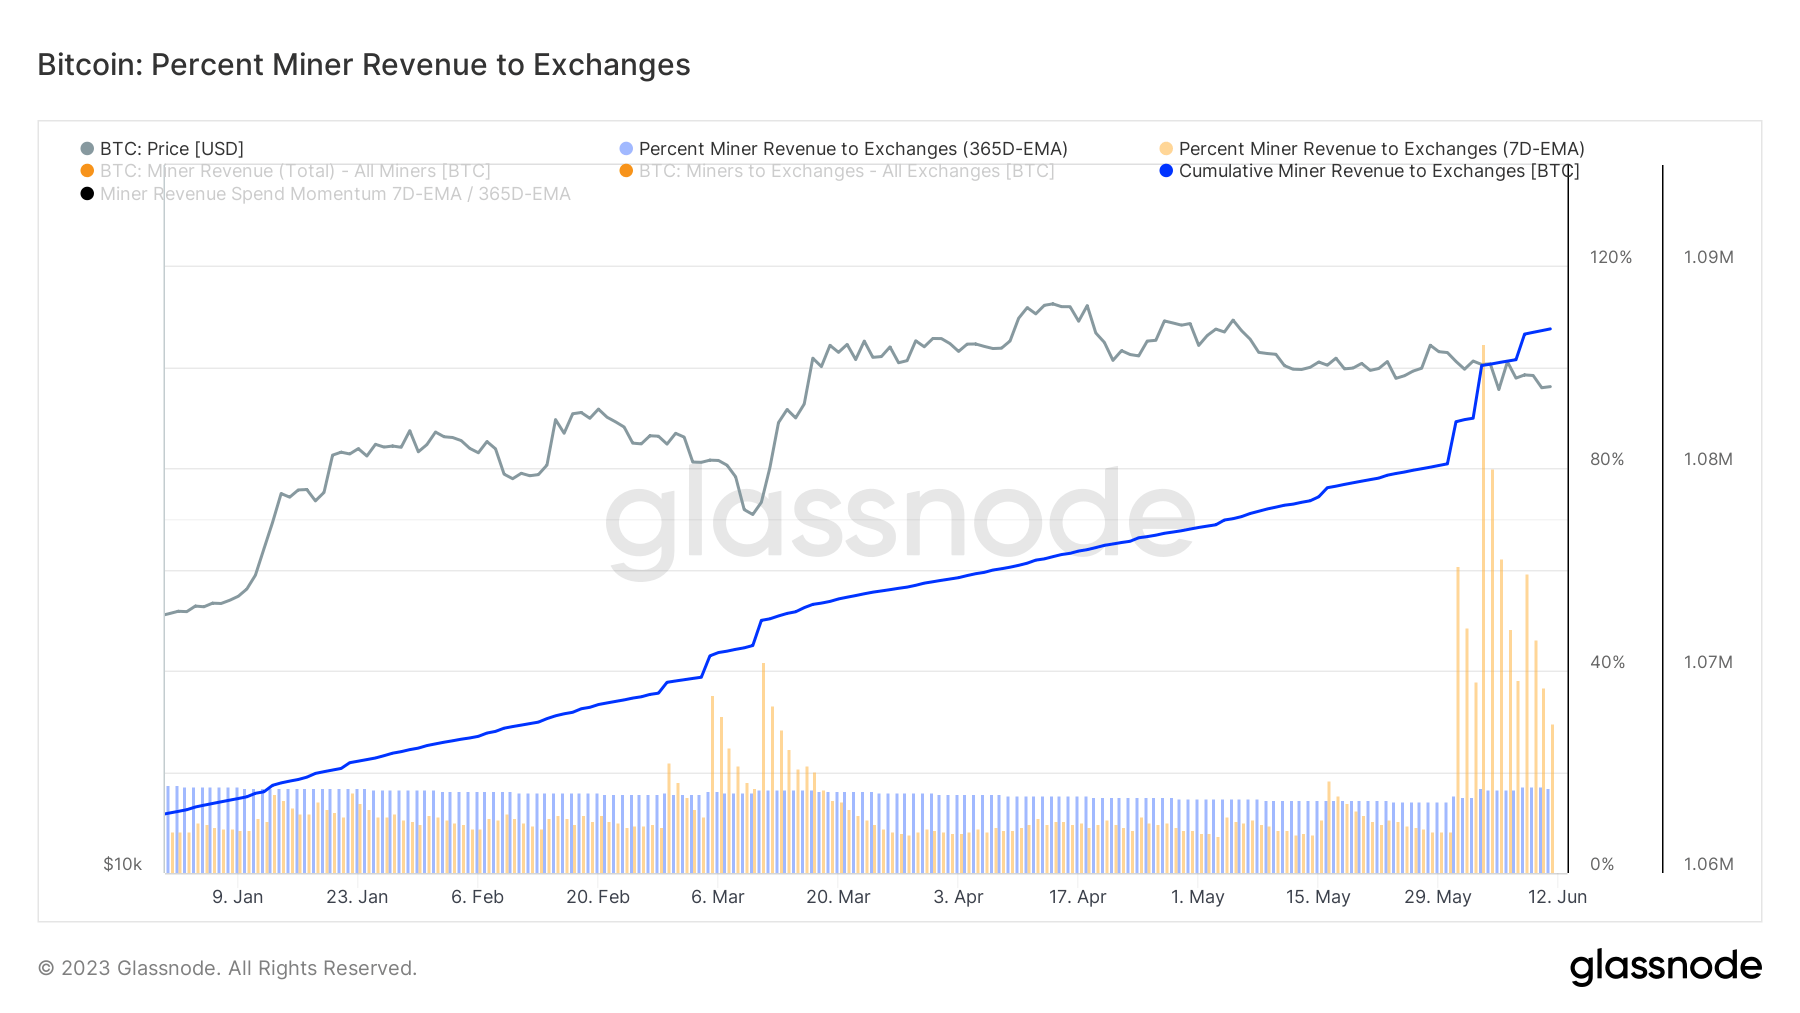
The increase in miner transfers led to an abrupt rise in the proportion of miner revenue sent to exchanges. CryptoSlate analysis found that the 7-day exponential moving average (EMA) of miner revenue to exchanges reached 104.5% on June 3.
An EMA is a vital financial metric that provides more weight to recent data, smoothing out the data line and revealing trend shifts more effectively. This EMA value is the highest recorded since November 17, 2014, when it reached 131.7%.

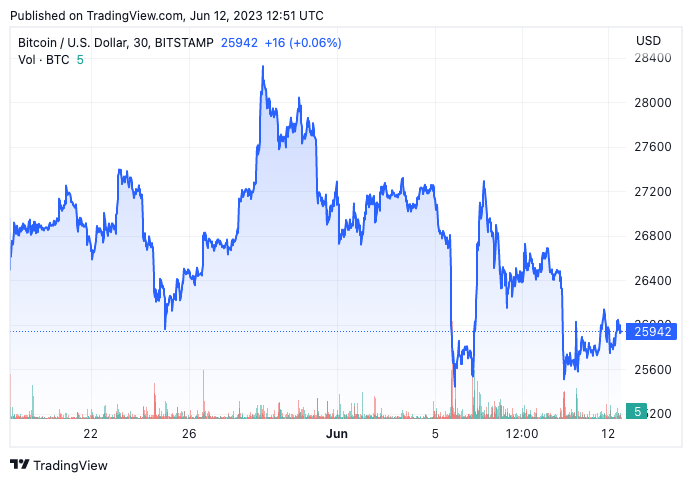
Bitcoin’s price remained relatively stable, hovering between $26,800 and $27,300 from May 31 to June 4. The sharp downturn on June 5 was more likely a reaction to news about the SEC’s lawsuit against Binance and Coinbase rather than an increase in exchange selling pressure from miners, as the price rebounded within 24 hours.

This suggests that miners may be opting to liquidate their coins via over-the-counter (OTC) methods or retain them on exchanges in anticipation of more favorable market conditions.


