Bitcoin is back up after a one-week consolidation phase. Today, BTC reached a yearly high of $9,400, and according to several analysts and professional traders, could be preparing for new highs this upcoming week.
Bitcoin Technical Analysis
According to Thomas Lee, the CEO at Fundstrat Global, the bear market is over and investors could be about to “FOMO” in and take Bitcoin into a massive rally similar to what happened in the 2017 bull market.
Taking a step back, with $BTC #bitcoin at new 2019 highs, don’t those old highs look like a few FOMO days away?
Crypto winter is over… pic.twitter.com/1neKiEzaFA
— Thomas Lee (@fundstrat) June 16, 2019
The sentiment in the market seems to have changed completely and as more crypto enthusiasts, such as Max Keiser, the host of RT’s Keiser Report, are speculating that the $20,000 milestone is within reach. More yet, it’s possible that BTC could surpass this previous high, according to analysts.
$28,000 still in play.
$100,000 target first predicted in 2011 still in place. #Bitcoin
— Max Keiser, tweet poet. (@maxkeiser) June 16, 2019
Jeremy Allaire, CEO of Circle, points out that the market could be preparing for a massive bull rally that will be triggered by Facebook’s launch of Libra and BTC could hit $10,000 as soon as June 21.
Crypto market rallying (again) ahead of Libra launch, marking a massive inflection point in global adoption of cryptocurrency. BTC > $10k by June 21st, marking start of Crypto Summer.
— Jeremy Allaire (@jerallaire) June 15, 2019
As the market valuation of Bitcoin rises to new yearly highs, the hash rate—the computing power consumed by the network—reached a new all-time high of 62 million terahashes per second on June 14. As more mining nodes become active, more security is added to the BTC blockchain reducing the risk for malicious attacks.
A similar pattern can be seen in the number of Bitcoin transactions conducted on the network, which is again back over 1 million transactions. According to Vortex, the host of the Bitcoin News Show on The World Crypto Network, and Mati Greenspan, senior market analyst at eToro, these two network fundamentals are positive signs for the price of Bitcoin.
#Bitcoin breaking yearly price highs, hash rate highs, and daily active address highs all in the same day.
Bullish.
— Vortex (@theonevortex) June 15, 2019
On the other hand, @XRPcryptowolf believes that the recent upswing is solely attributed to Tether. A sum of 100 million USDT was minted today that could have been used to pump the market. This year more than 1.5 billion Tethers have been added into the market, which is equivalent to around 9 million new USDT per day.
100 Million #Tether Were Just Printed So Now It’s Obvious That #Bitcoin Is Being Pumped By $USDT
The pump in $BTC is clearly a bull trap cause #Tether was also printed during the 2017 bull run to pump & manipulate the prices
Expect a huge correction later after the pump is over https://t.co/a22PqjhCFX
— XRPcryptowolf (@XRPcryptowolf) June 16, 2019
Whatever the reason might be for the rising valuation of Bitcoin, the bull trend seems to continue and @BigCheds, a technical analyst, suggests that a golden cross, similar to the one between the 8 and 34-week exponential moving average on Oct. 2015, is developing, which initiated the rise to the high of $20,000 on Dec. 2017.
If you played the 8/34 EMA cross on the $BTC #Bitcoin Weekly you would have –
1) Bought at $260 Oct 2015
2) Sold at $8500 May 2018
3) Bought at $5000 April 2019And we are now over $9,000
Just sayin’ pic.twitter.com/vQJIt1Rp1k
— Big Cheds (@BigCheds) June 16, 2019
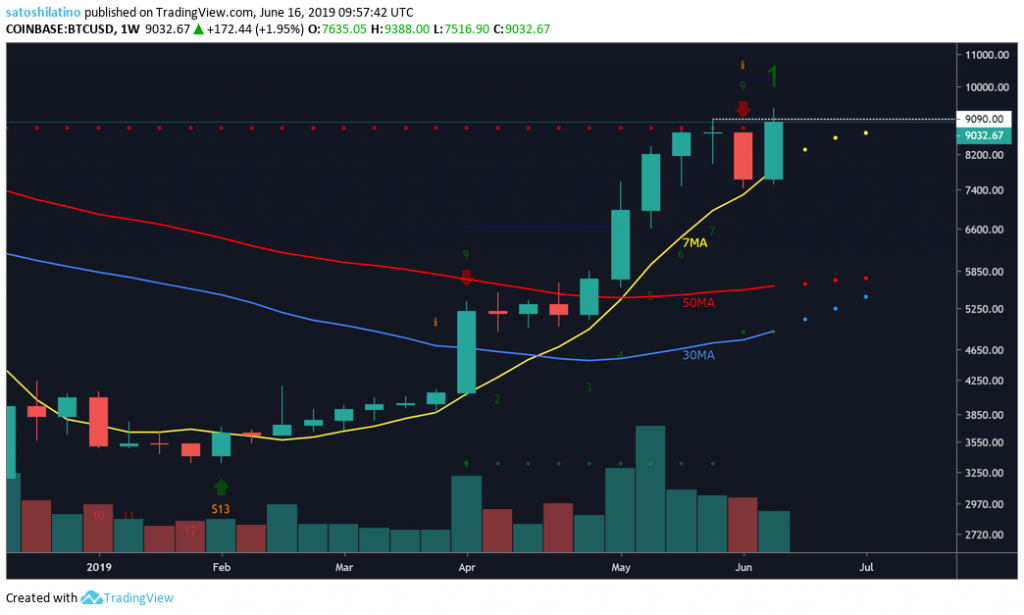
As a matter of fact, the sell signal given by the TD Sequential Indicator with a green nine candlestick on the 1-week chart seems to have been invalidated since the current week’s candlestick has managed become a bullish engulfing candlestick pattern trading above the previous high of $9,090.
A buy signal will be given under this timeframe by the TD Sequential Indicator once, and if, next week’s candlestick is a green two trading above the close of the current green one candlestick, which could set BTC up for another seven weeks of upward movement.
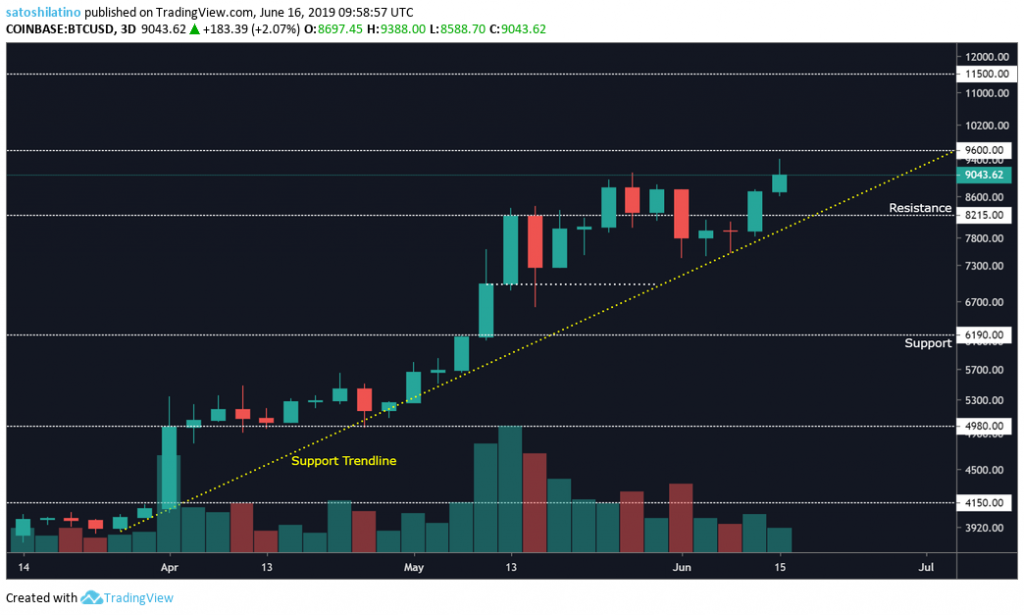
 On the 3-day chart, the support trendline was able to hold the price of Bitcoin from a further drop. Now that BTC was able to break the $8,200 level of resistance, the next level of resistance is around $9,600. Breaking above this price barrier could take BTC up to $10,000 or $11,500 as explained by the economist Alex Krüger.
$BTC just traded new year highs.
Next major resistance levels: 9600, 10000, 11500-11750, 13000, 15000, 17400, 20000, moon.
— Alex Krüger (@krugermacro) June 16, 2019
Based on the recent price action BTC has had during the last few days, the $9,600 resistance could act as a selling point for many investors triggering a new consolidation period between $8,200 and $9,600.
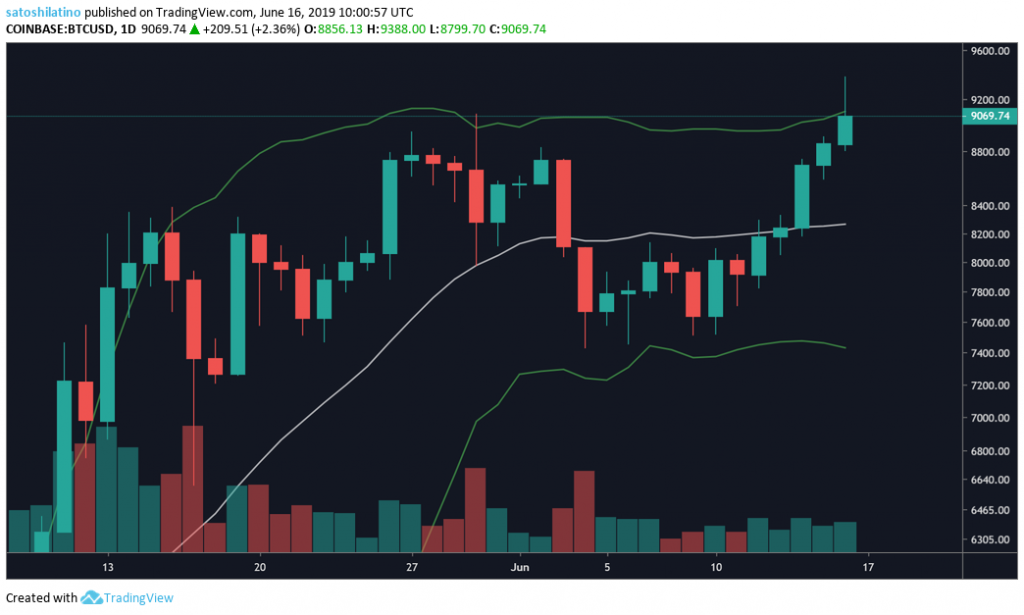
Bitcoin has reached the upper Bollinger band on the 1-day chart. This could indicate that a pullback to the middle band (20-day moving average) will come before the continuation of the bullish trend.
Upwards movement will also depend on whether volume starts picking up since the recent move does not seem to be supported by strong buying pressure, or as Jacob Canfield, a technical trader described it “dwindling volume.”
I don’t typically like to try and call tops, but this feels pretty toppy to me.
I see a lot of really bullish traders.
– Dwindling volume
– Bearish RSI
– High time frame resistanceWatching for this trend break. pic.twitter.com/mocjcEnmEk
— Jacob Canfield (@JacobCanfield) June 16, 2019
Overall Sentiment
The bullish trend seems strong as Bitcoin continues making new yearly highs and more Tethers are minted. Different sell signals based on technical indicators, such as the TD Sequential Indicator, have been invalidated adding more credibility to the idea that the bull market started.
As Facebook prepares to launch a new cryptocurrency, all eyes are on Bitcoin waiting to see if the “King of Cryptos” will be affected by the introduction of this new ‘cryptocurrency.’
@Rhythmtrader believes nothing will be able to stop Bitcoin since the last time it broke above $9,000, the big players in the tech and financial sector were not interested in it.
The last time Bitcoin rose above $9,000:
Fidelity wasn’t storing it.
Congress wasn’t fighting it.
Bakkt wasn’t launching with it.
Microsoft wasn’t building on it.
TD Ameritrade wasn’t trading it.
Whole Foods wasn’t accepting it.
Facebook wasn’t competing with it.
— Rhythm (@Rhythmtrader) June 16, 2019
Bitcoin Market Data
At the time of press 2:52 am UTC on Nov. 7, 2019, Bitcoin is ranked #1 by market cap and the price is up 3.32% over the past 24 hours. Bitcoin has a market capitalization of $165.09 billion with a 24-hour trading volume of $20.4 billion. Learn more about Bitcoin ›
Crypto Market Summary
At the time of press 2:52 am UTC on Nov. 7, 2019, the total crypto market is valued at at $288.63 billion with a 24-hour volume of $68.41 billion. Bitcoin dominance is currently at 57.34%. Learn more about the crypto market ›


