Despite the recent downturn, Bitcoin has a year-to-date (YTD) return of 111 percent showing that “HODLing” could be a lucrative strategy.
HODLers in profits
After peaking at nearly $14,000 on June 26, Bitcoin entered a corrective phase that has seen its price drop over 50 percent. The flagship cryptocurrency went down to hit a low of $6,620 on Nov. 25. And, it has mostly been trading under $7,500 since then.
The high levels of volatility that Bitcoin experienced throughout the year could have made it difficult to perfectly time trades, according to Skew, one of the leading providers of crypto derivatives data analytics.
In a recent tweet, the London-based firm revealed that the pioneer cryptocurrency was up 24 weeks out of the 48 weeks of 2019. BTC literally spent 50 percent of the year up and the other 50 percent down. Skew maintains that those who dared to trade Bitcoin in 2019 were playing a “dangerous game.”
Conversely, those investors who “HODL” their positions throughout the year could have profited massively. The 24 weeks that Bitcoin surged represent a higher percentage of gains compared to the losses incurred when this crypto went down. In fact, Bitcoin holds a YTD return of 111 percent. And, it could have recently entered an accumulation phase before the next upswing.
The infamous buy zone
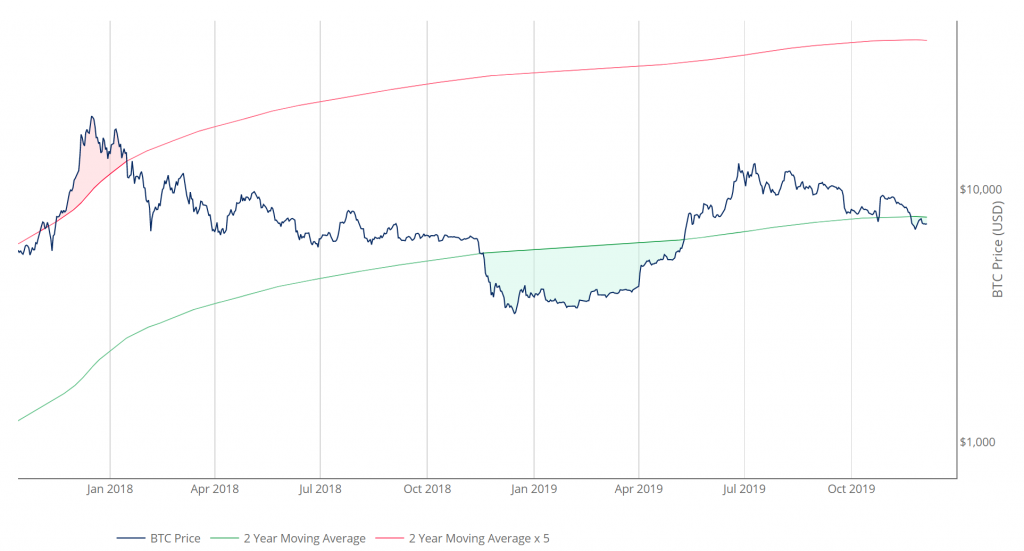
Based on the 2-year moving average (MA) multiplier indicator, Philip Swift, the founder of Look Into Bitcoin, believes that there are five stages in every Bitcoin market cycle. These are created by periods in which investors are “over-excited” about BTC causing the price to “over-extend.” And, other periods where investors are extremely “pessimistic” about the pioneer cryptocurrency making its price “over-contract.”
Under the premise of a cyclical market, Sawcruhteez, a financial analyst and swing trader, said that Bitcoin went back into the first stage of its market cycle. This one occurs when BTC moves below the 2-year MA, which is considered the “accumulation” phase.
Swift, the creator of the 2-year MA multiplier indicator, argues that:
“Buying Bitcoin when the price drops below the 2-year MA has historically generated outsized returns.”

Although the “accumulation” phase usually extends for a few weeks before an explosive move takes place, it seems like HODLers will soon see their gains increase further. Now, it remains to be seen when Bitcoin will move above the 2-year MA once again to enter the second stage of the market cycle, dubbed Breakout.


