Bitcoin’s recent price action has largely favored sellers, as the benchmark cryptocurrency is currently trading down roughly $1,000 from its weekly highs of just over $9,800.
The decline from these highs came about after multiple failed attempts to break above $10,000, pointing to some underlying weakness amongst BTC buyers.
This price plunge has also caused the cryptocurrency to see a sharp downturn in its market health over a one-week period. This network health decline stems from a decrease seen across BTC’s network growth, liquidity, and investor sentiment.
These factors could spell trouble for where the cryptocurrency trends in the week ahead.
Volatile price action leads Bitcoin to pivotal level
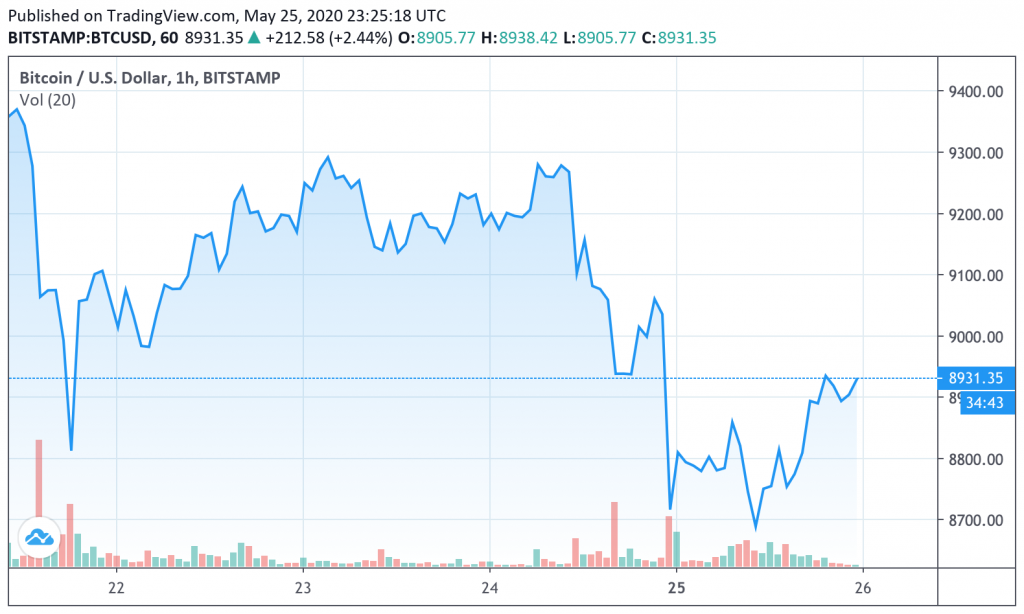
At the time of writing, Bitcoin is trading down just under 1 percent at its current price of $8,905. This marks a notable rebound from lows within the $8,600 region that was set during a sharp decline yesterday.

The cryptocurrency’s dip to these lows was ardently absorbed by bulls, who subsequently allowed it to climb to its current price levels.
$8,800 is a historically important level for Bitcoin, as it has acted as strong support on multiple occasions in recent times.
Whether or not it is able to remain above this price level could be one of the sole factors that determine which direction it will trend in the days and weeks ahead.
BTC’s $1,000 selloff leads to a sharp decline in network health
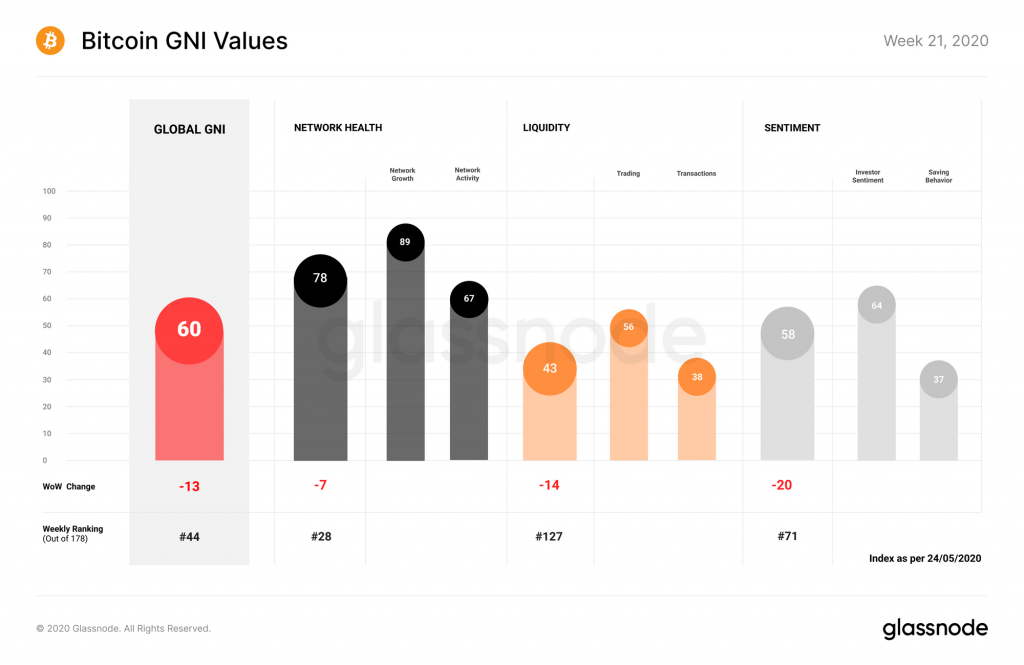
Bitcoin’s network health – as indicated by Glassnode’s proprietary GNI indicator – took a hit this week in the wake of the crypto’s recent decline.

According to the analytic firm’s latest weekly report, all three core components of the GNI indicator saw a sharp regression over the past week.
They note that although Bitcoin’s network health is high over a macro timeframe, a sharp drop in its network growth and overall activity has led this indicator to shed seven points.
A similar trend can be seen while looking towards BTC’s liquidity, which is currently at its lowest value seen since January of this year. They note that this slip has largely been sparked by lessened on-chain transaction volume and a decrease in exchange inflows.
The sharpest decline by far can be seen while looking towards the sentiment component of the GNI, which shed 20 points this week.
Glassnode spoke about this, saying:
“This has been driven by an overall decrease in economic activity in relation to the price of BTC, as well as a slowing down of hodlers’ accumulation behavior; while hodlers are still accumulating, the rate at which they are doing so is declining.”
Although the link between the GNI’s components and Bitcoin’s price action is not necessarily causal, it does indicate that the immense fundamental strength seen in recent months is beginning to wane.
Bitcoin Market Data
At the time of press 12:59 am UTC on May. 27, 2020, Bitcoin is ranked #1 by market cap and the price is down 0.81% over the past 24 hours. Bitcoin has a market capitalization of $162.39 billion with a 24-hour trading volume of $29.59 billion. Learn more about Bitcoin ›
Crypto Market Summary
At the time of press 12:59 am UTC on May. 27, 2020, the total crypto market is valued at at $247.79 billion with a 24-hour volume of $95.01 billion. Bitcoin dominance is currently at 65.52%. Learn more about the crypto market ›


