Bitcoin’s recent price action has been firmly controlled by sellers, who have been able to successfully push BTC down to its November 25th lows of $6,500 that were previously viewed as a potential long-term bottom for the cryptocurrency.
Now that Bitcoin is back at this level, there are a couple key price levels that analysts are closely watching, as its reaction to these levels in the near-term could provide significant insight into where the embattled markets are heading next.
Bitcoin revisits key long-term support level at $6,500
At the time of writing, Bitcoin is trading down nearly 5 percent at its current price of $6,600, which marks only a slight climb from its daily lows of $6,500 that were set a few hours ago as bears successfully attempted to extend the short-term downwards momentum that began when it broke below $7,000 yesterday.
Bitcoin’s reaction to its current price levels will be telling as to whether or not bulls have a chance at reversing this current trend, or if sellers will continue to push the cryptocurrency further down.
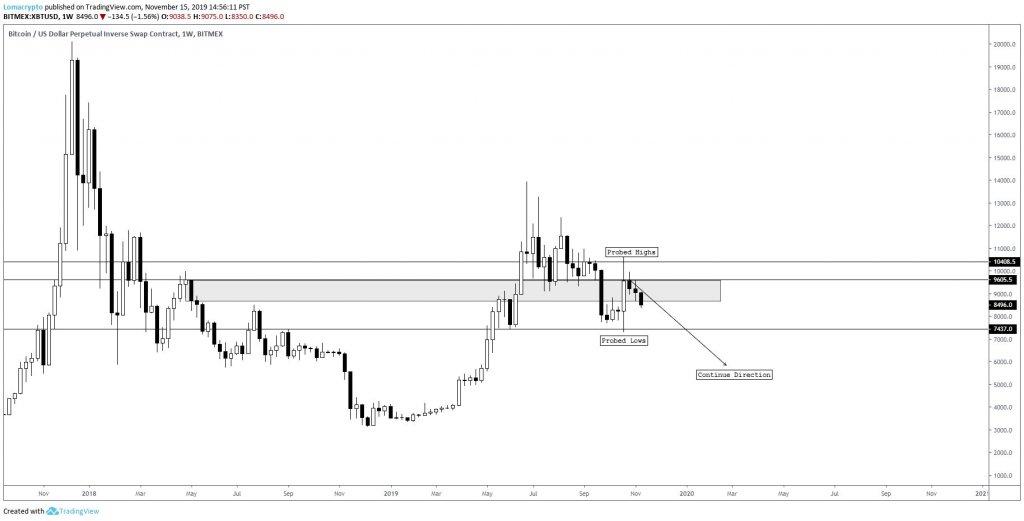
Analysts do anticipate BTC to see further near-term losses, with Lomah, a widely respected trader and technical analyst on Twitter, telling his followers that he believes $6,000 will be a long-term bottom that proves to be a “generational long” opportunity.
“$BTC: Thinking ~$6,000 bottom and generational long before HTF markup. Anything below $5,400 and this entire niche community will be meeting up at McDonald’s,” he said while pointing to the chart seen below.

Technical indicators support notion that further losses are inbound
Although it remains unclear as to whether or not $6,000 will really be the price region that helps catalyze the next uptrend, it does appear that BTC will visit this price level in the near-term.
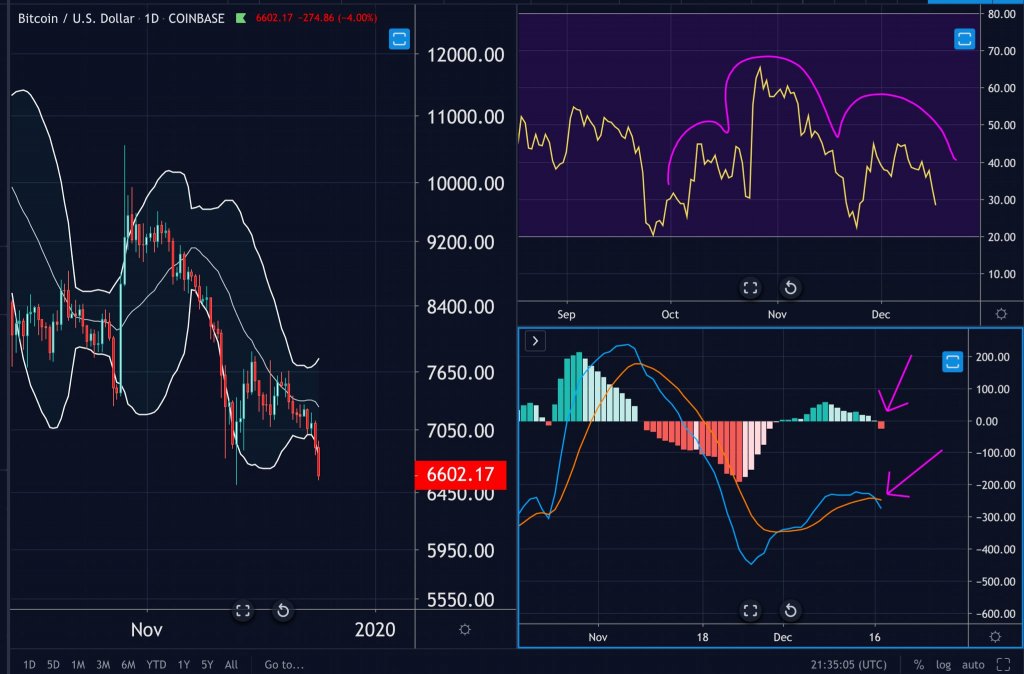
Big Chonis, a popular cryptocurrency analyst on Twitter, explained that multiple technical indicators are pointing to the possibility that further losses are imminent in the near-term. He noted while referencing the collage of indicators seen below:
“Bitcoin – daily [bollinger bands] widening with bitcoin declining and taking the middle [bollinger band] with it….RSI putting in a familiar pattern and the MACD bearish crossing with new negative histogram with room to run.”

If bears begin pushing Bitcoin below its near-term support at $6,500, its response to $6,000 will offer tremendous insight into where the entire markets are heading next.


