Since March’s lows, Bitcoin has gained over 100 percent, outperforming most other over $100 billion assets within the same time frame.
Yet, this may be the start of an even greater rally with a top on-chain analytics firm affirming that per their data, BTC is just transitioning to a “bullish” market regime, exiting the bear market it was embroiled in prior to the recent gains.
Bitcoin’s bullish market regime
With there being no cash flow statements and balance sheets to scrutinize to value Bitcoin, analysts have turned to the next best thing: on-chain data.
Due to the fact that blockchains are public, their data can be crawled by analysts to determine the health of a network, the composition of users, among many other things.
Glassnode, a leading firm in this field, has long leveraged this feature of blockchains. And just recently, it decided to fit that data into a market valuation model dubbed “Glassnode On-Chain BTC Index,” or GNI.
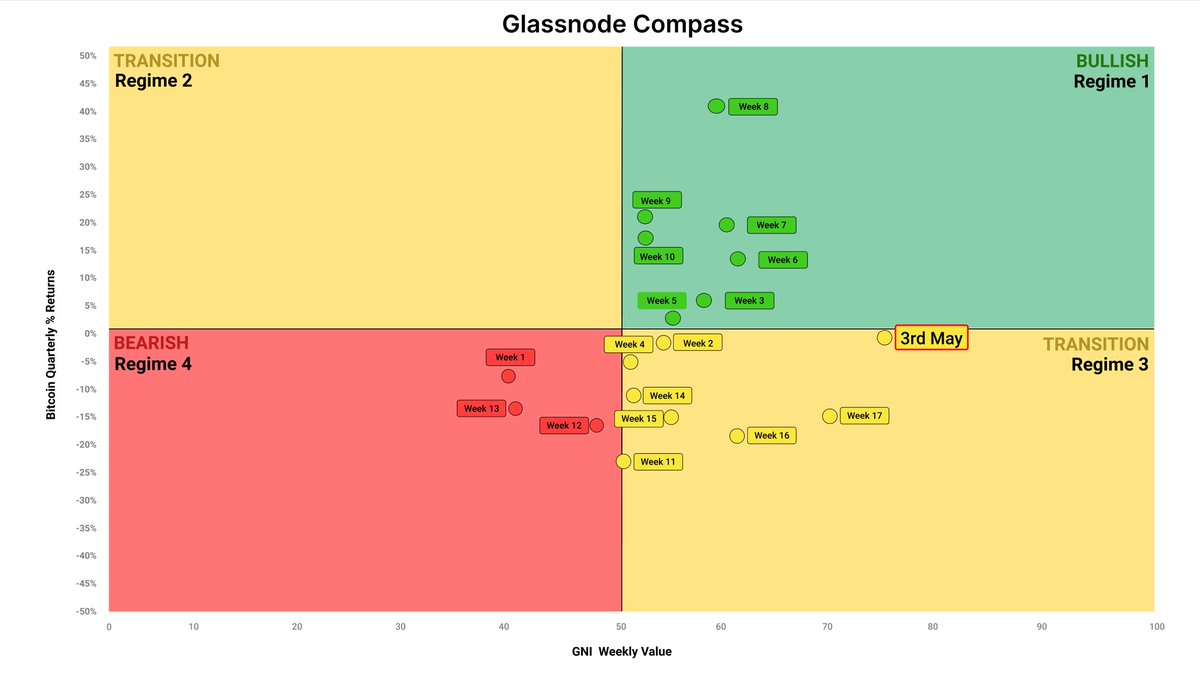
The GNI is derived from a number of indicators such as network growth, Bitcoin transactions, and investor sentiment in an aim to “yield insights” into “where Bitcoin may evolve.” This, in turn, can give the company expectations as to how the cryptocurrency market will develop:
“Historically strong on-chain fundamentals coincide with good Bitcoin performance and vice-versa,” the firm wrote in the report, referencing their backtest of the accuracy of the GNI.
The data company found that by charting Bitcoin’s GNI and quarterly returns (in percent), you can determine which way BTC is trending on a macro scale. Glassnode wrote that as of May 3, BTC “has been moving strongly towards the bullish quadrant,” suggesting a bull market is imminent.

This is surely the case. Per previous reports from CryptoSlate, Bitcoin’s hash rate recently hit a new all-time high, reaching a level nearly 1,000 percent higher than that seen during the $20,000 highs in 2017.
Technicals share a similarly bullish picture
The technicals also suggest that Bitcoin is entering into a bullish phase.
I recently compiled the chart below, which shows BTC’s price action over the past three and a half years along. The red vertical lines mark every time the one-week Moving Average Convergence Divergence (MACD) crossed into green territory, suggesting a bullish trend.
The MACD, as Investopedia describes, is an indicator revealing “changes in the strength, direction, momentum, and duration of a trend.”
What’s pertinent is that just last week, the indicator crossed bullish for Bitcoin, suggesting the start of a bull trend.
Case in point: in 2017, the indicator flipped green at $2,000 to mark the start of a 1,000 percent rally to $20,000. At the start of 2019, Bitcoin rallied 300 percent when the indicator trended green in January. And just earlier this year, it trended green prior to BTC rallying from the $8,000s to $10,500.
Adding to this confluence, we reported that Bitcoin’s latest rally allowed the cryptocurrency to capture the bottom of its logarithmic growth curve. This curve is important as BTC has traded within or very close to its vicinity for over eight years; for instance, both 2017’s bull market top and 2018’s bear market bottom were marked by the curve.
Bitcoin retaking the curve would suggest it is ready to see continued growth.
Bitcoin Market Data
At the time of press 7:06 pm UTC on May. 7, 2020, Bitcoin is ranked #1 by market cap and the price is up 5.39% over the past 24 hours. Bitcoin has a market capitalization of $179.89 billion with a 24-hour trading volume of $55.5 billion. Learn more about Bitcoin ›
Crypto Market Summary
At the time of press 7:06 pm UTC on May. 7, 2020, the total crypto market is valued at at $265.44 billion with a 24-hour volume of $177.26 billion. Bitcoin dominance is currently at 67.91%. Learn more about the crypto market ›


