Bitcoin (BTC) is at the very early stages of its adoption and data indicates that it will enter its exponential growth phase and break past 10% adoption in the year 2030, according to blockchain infrastructure and bitcoin mining company Blockware Solutions’ user adoption report.
The report compares Bitcoin’s current adoption rate to other technologies’ historical data and notes that, based on Bitcoin’s short history and its current location on the expected adoption chart, the expected increase in adoption may come even faster than other historical examples.
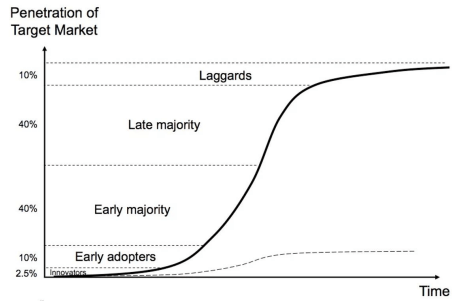
The s-curve
An s-curve graph emerges when the historical adoption rates from disruptive technologies such as automobiles, landlines, tablets, cellular and smartphones, radio, electric, internet, and social media are summarized together.

Innovators, who create the first 2.5 adoption rate are entrepreneurs looking for the next best investment. The early adopters, according to the report are:
“These are highly open-minded individuals who have direct or indirect connections with the innovators. Early adopters often face intense scrutiny and pushback from outsiders.”
The late majority stage is reached when the technology becomes mainstream and is used in everyday objects. The last 10%, Laggards, refer to those who have been reluctant, or in a position that made them unable to accept the new technology. When these individuals or entities also integrate the technology in question the S curve reaches its peak.
Even though the stages of adoption rates are the same for all disruptive technologies, the speed of going through this cycle increases in time, the report also concludes. For example, it took landline technology 40 years to reach the late majority stage, while the internet did it in 10 years.
Where is Bitcoin?
In an effort to quantify the Bitcoin adoption rate properly, the report takes the number of new entities that ever appear in a transaction and their net growth into account.
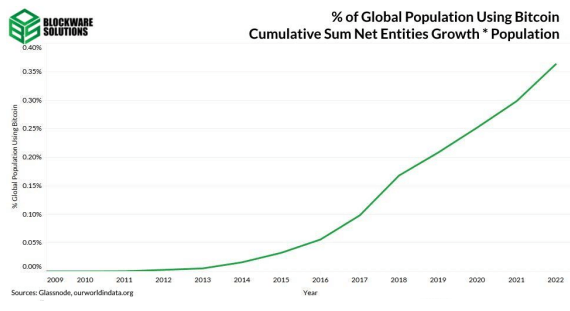
When it is compared to the global population, the report estimates the current Bitcoin adoption rate as 0.36%.

In terms of speed of adoption, the resulting chart appears as above. While staying relatively stagnant from 2009 to 2015, the adoption accelerates exponentially starting in 2016.

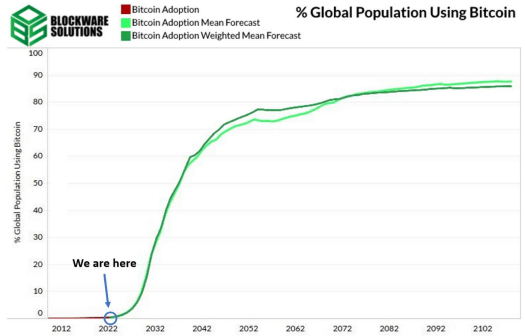
The chart above appears when the current Bitcoin adoption rate is placed on Bitcoin’s expected S-curve adoption chart. Although the report states that the current Bitcoin community behaves like the early adoption group, there are still four more phases to go for Bitcoin’s global adoption.
The report used a 10-year compounded annual growth rate (CAGR) of the unique users on the Bitcoin network — which it estimates to be 30.8 million — and then divided it by the expected global population in each year to convert the raw number of users to a percentage of the population, in order to forecast the growth period from the current state of adoption up to 10% adoption.
Blockware states that it is using this CAGR up to the 10% threshold because data of past technology adoption curves is unavailable before they reach this approximate threshold.
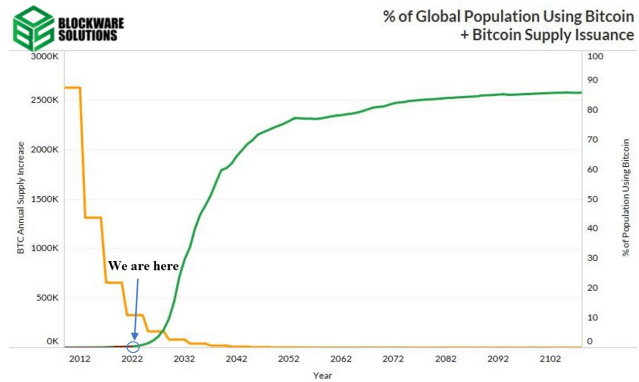
As adoption follows its estimated s-curve, Bitcoin supply will diminish due to the halvings in its code, the report states.

As a result, while the adoption rate reaches the stage where Bitcoin becomes mainstream and is used in everyday life, its supply will reach its maximum level. The adoption rate, and therefore the demand will continue to increase in the upcoming years while the supply does not change.


