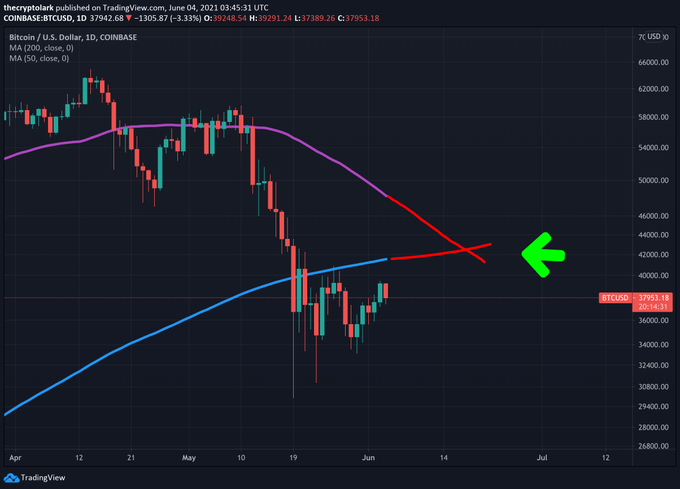
Crypto YouTuber Lark Davis points out that Bitcoin is headed for a death cross “unless something changes soon.” At the current trajectory, the bearish technical pattern will occur in mid-June.
Unless something changes soon for #bitcoin then we could be staring down a death cross in mid June!!! pic.twitter.com/K3pkvNrnPx
— Lark Davis (@TheCryptoLark) June 4, 2021
The warning comes as everything that could go wrong for Bitcoin is going wrong. This morning, Elon Musk posted a “heartbreak” tweet that coincided with a 3% fall on the hour. Bitcoin continues sliding as the morning wears on.
After Bitcoin’s 54% crash a little under a month ago, talk of a return to crypto winter dominates. With a death cross on the cards, does this mean the end of the bull market?

Bitcoin bulls need to step up
The Bitcoin price was rejected at $39.2k. This level has become a strong resistance zone, having been rejected here on six occasions in the last two weeks.
Although death crosses are often spoken about as the start of a long and enduring bearish period, analyst Rekt Capital doesn’t believe that is always the case. “Still macro bullish but more downside will likely be confirmed when the Death Cross occurs,” they tweeted.
Having said that, if the death cross does occur, Rekt Capital predicts this could see Bitcoin at $18k. This calculation is based on the symmetry of crash percentage loss pre and post-death cross.
15.
So since #BTC has crashed -54% already and should this symmetry hold, BTC could crash an extra -54% if a Death Cross happened today
This would result in a ~$18,000 $BTC pic.twitter.com/01Dc41PtK1
— Rekt Capital (@rektcapital) June 1, 2021
Having already crashed by 54% on the Elon Musk energy FUD, another 54% drop is expected if the death cross occurs.
“So since #BTC has crashed -54% already and should this symmetry hold, BTC could crash an extra -54% if a Death Cross happened today. This would result in a ~$18,000 $BTC,” they said.
How reliable is the death cross as an indicator of severe retracement?
The death cross is a technical chart pattern indicating the potential for a significant sell-off. It appears when an asset’s short-term moving average crosses below its long-term moving average.
Analysts most commonly use the 50-day and 200-day moving averages to represent these time frames.
They have proven to be a reliable predictor of some of the most severe legacy bear markets, such as in 1929, 1938, 1974, and 2008. But as Rekt Capital mentioned, they don’t always live up to their name.
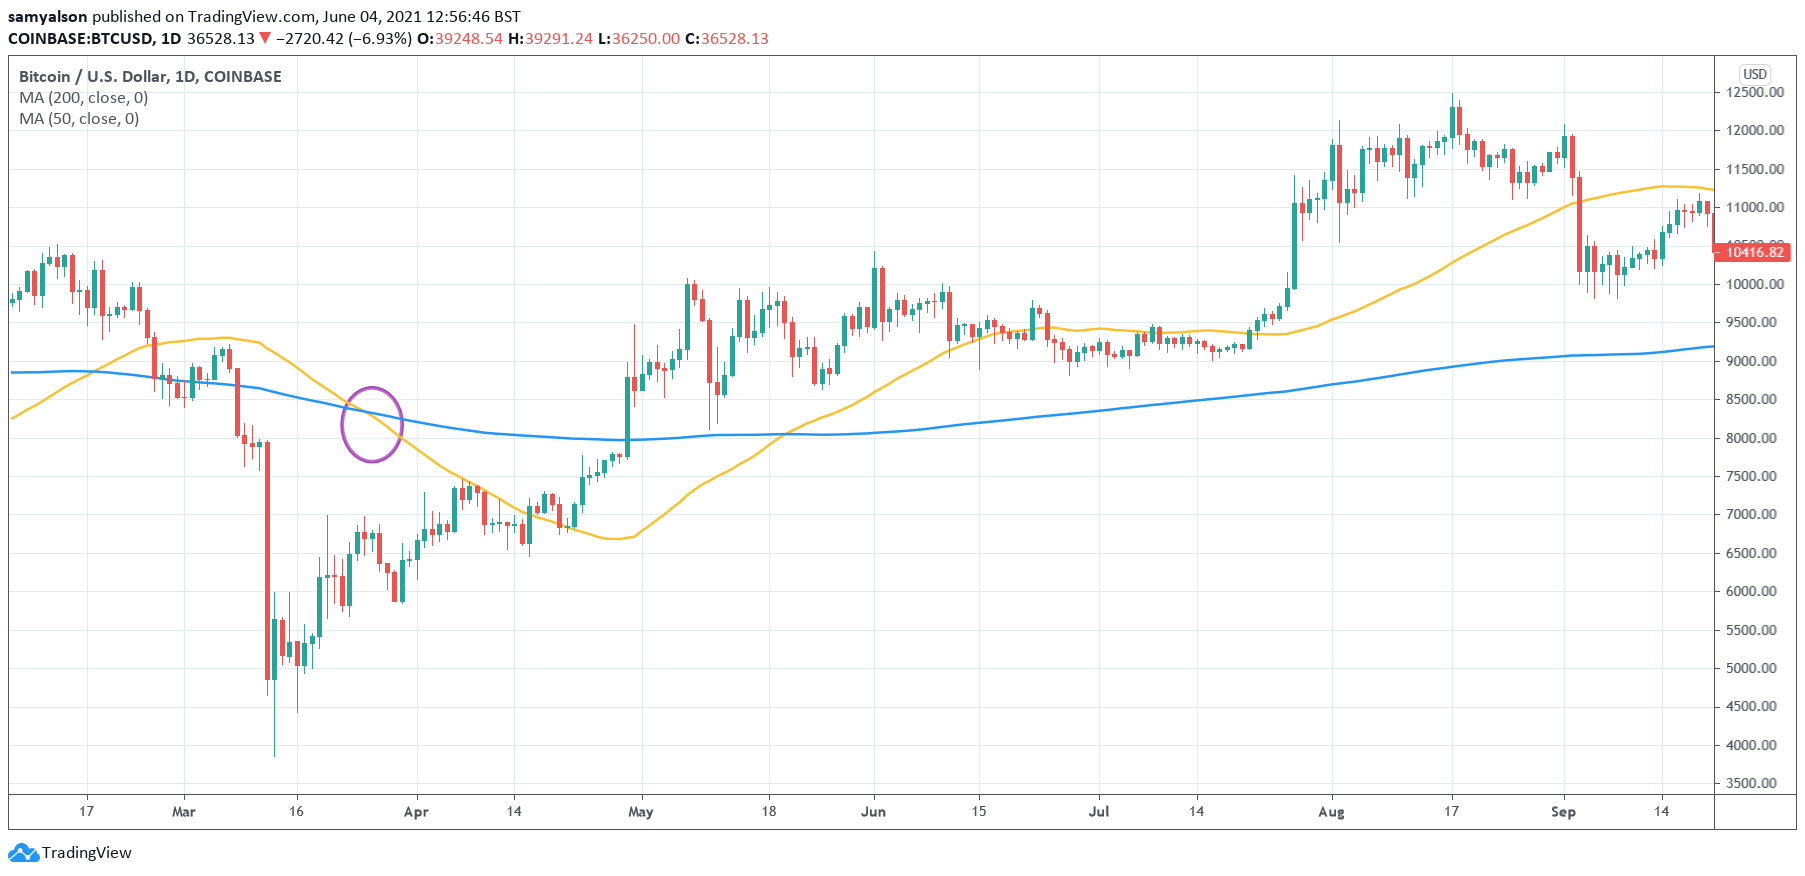
The last time a death cross occurred on Bitcoin was late March 2020, shortly after the “Corona crash.” The death cross resulted in a relatively negligible drop from $6.7k to $5.9k (-12%) over three days.
A golden cross, where the 50-day MA crossed above the 200-day MA, occurred about six weeks later.

All the same, there are no guarantees that a similar outcome will occur if we get a death cross in the next week or so.


