Bitcoin has seen its price depreciate significantly over the past two weeks. The downward movement triggered a state of commotion among market participants who are concerned about the fate of the flagship cryptocurrency. The following analysis evaluates whether Bitcoin’s uptrend remains intact from a long-term perspective.
Bitcoin may have reached a tipping point
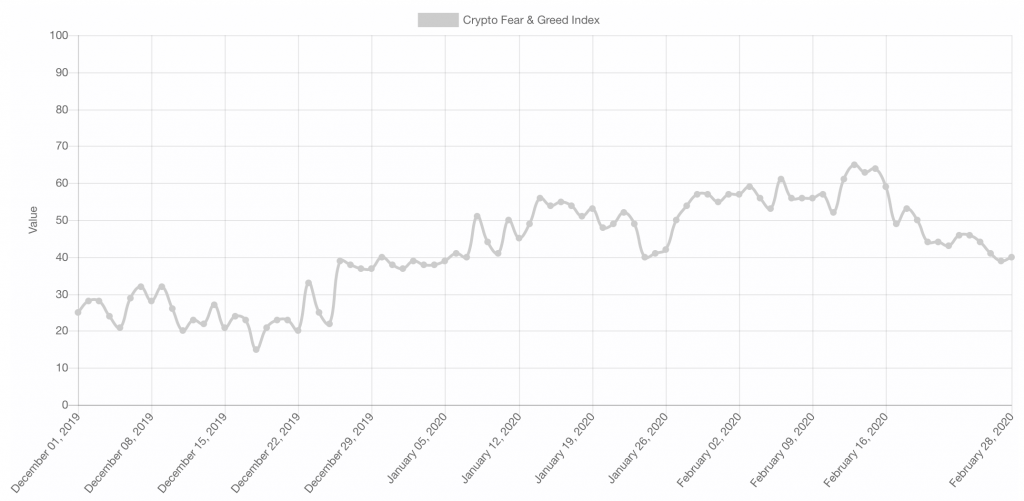
Following a 62 percent bull rally, Bitcoin peaked at $10,500 on Feb. 13. Since then, the flagship cryptocurrency plummeted nearly 20 percent to recently hit a low of $8,455. The significant selling pressure appears to have sent investors into fear, according to the Crypto Fear and Greed Index (CFGI).
This fundamental indicator analyzes the emotions and sentiments from different sources, such as volatility, volume, social media, surveys, and market dominance. These values are combined into one simple number. A value of 0 means “extreme fear” while a value of 100 represents “extreme greed.”
The CFGI hit a value of 39 (fear) on Feb. 27. This is the lowest value this index has reached since the beginning of the year when market participants prepared for a possible drop below $6,000.

The current correction coincides with a significant reduction in on-chain economic activity, according to Glassnode. The blockchain data and intelligence provider firm maintains that in the past week different on-chain fundamentals have dropped substantially. USD volume fell over 18 percent, raw transaction count plunged more than 2 percent, and the number of active addresses and entities also plummeted.

Everything’s not lost
Although the price of Bitcoin continues to tumble, Glassnode pointed out that the decrease in active entities has “slowed to a halt.” This can be considered a positive sign that indicates a potential recovery in on-chain economic activity and provides hope for an upswing in the coming weeks.
Adding credence to the bullish outlook, the pioneer cryptocurrency recently formed a golden cross on its 1-day chart. Many respected analysts in the industry consider this technical formation to be one of the most reliable reversal patterns. The fact that BTC dipped right into the 50 and 200-day moving average crossover increase the probabilities for a continuation of its bullish trend.
The general consensus identifies support around $8,200 and $8,500, according to Glassnode. This support barrier could prevent Bitcoin from a steeper correction. However, market participants are also aware of the possibility that BTC may fall below $8,000. Such a bearish impulse would likely increase the chances of an even stronger retracement.
Regardless, the MVRV Z-Score suggests that Bitcoin is still undervalued and has “significantly more room to grow before reaching the next market top,” affirmed the Germany-based firm.

A similar outlook is presented by the Short Term Holder MVRV, which takes into consideration the behavior of short-term investors. This index has climbed and remained comfortably above 1 suggesting a further advance.
Glassnode said:
“Historically, this has correlated with uptrends in the price of BTC, suggesting fundamental support for higher prices. Barring any radical events that might affect confidence in the market, this metric suggests that BTC has room for more imminent growth.”

Moving forward
Rekt Capital, a renowned technical analyst in the crypto community, wrote a blog post dubbed “Bitcoin Halving — everything you need to know.” There, the chartist was able to determine that 100 days before the 2012 halving, Bitcoin dropped over 50 percent. A similar behavior took place 24 days before the 2016 block rewards reduction event. During that time, the pioneer cryptocurrency plunged 38 percent.
Even though there are not any “outstanding commonalities” between these corrections, the current retracement began 87 days before this year’s halving. Now, investors must be aware of the price action that has taken place after each block rewards reduction event. This could serve as an indication of where Bitcoin is heading next.
Bitcoin Market Data
At the time of press 3:05 pm UTC on Feb. 29, 2020, Bitcoin is ranked #1 by market cap and the price is down 0.38% over the past 24 hours. Bitcoin has a market capitalization of $157.48 billion with a 24-hour trading volume of $39.15 billion. Learn more about Bitcoin ›
Crypto Market Summary
At the time of press 3:05 pm UTC on Feb. 29, 2020, the total crypto market is valued at at $246.2 billion with a 24-hour volume of $140.89 billion. Bitcoin dominance is currently at 63.94%. Learn more about the crypto market ›


