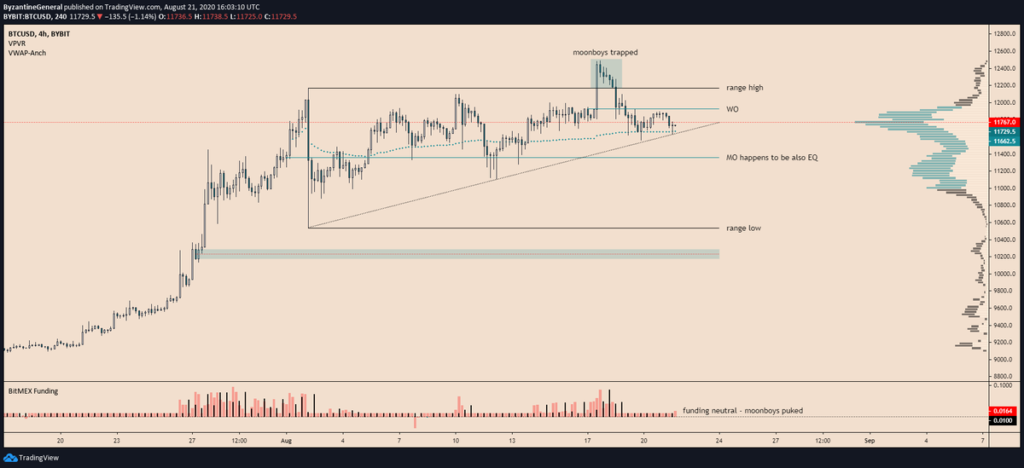
Bitcoin is showing some signs of weakness today as its price drifts down towards its crucial short-term support level at $11,600.
This is the lower boundary of the trading range that it is currently caught within, with the upper boundary sitting at $12,000.
This range has held strong for the past few weeks, with each visit past the upper boundary of this proving to be fleeting.
Despite this short-term weakness, analysts are noting that there are a few crucial factors that suggest BTC’s ongoing decline may be short-lived, with further upside potentially being right around the corner.
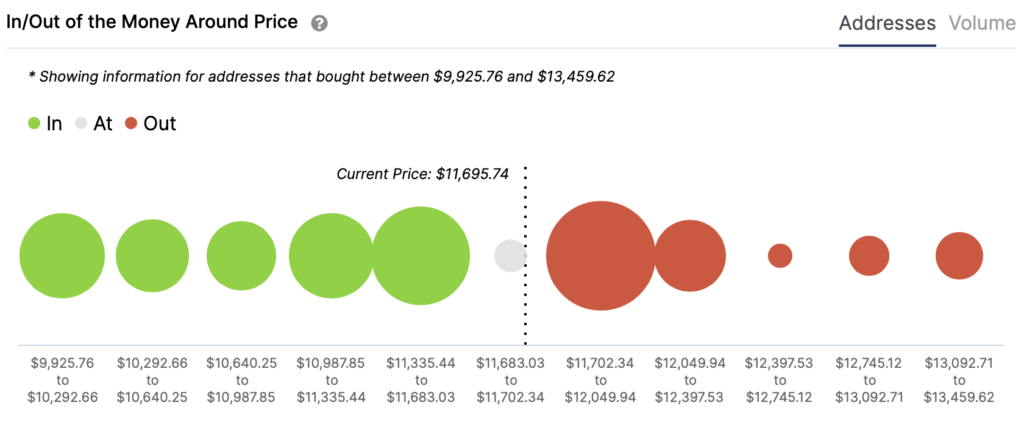
On-chain data seems to support this possibility, as a look at the profitability of investors shows that there is significant support just below Bitcoin’s current price level.
Bitcoin drifts towards $11,600 support as selling pressure ramps up
At the time of writing, Bitcoin is trading just below $11,700. This marks a notable decline from its weekly highs of $12,400 that were set earlier this week when bulls attempted to shatter its current trading range.
The cryptocurrency’s current weakness has sent shockwaves throughout the aggregated crypto market, with Ethereum now testing its $400 support level while many other altcoins post notable losses.
It doesn’t appear that this pullback has invalidated the market’s macro strength, with multiple technical factors all suggesting that BTC is well-positioned to see some near-term upside.
One analyst who trades under the pseudonym “Byzantine General” pointed to these factors, explaining that neutral funding, an intact ascending triangle, and its ability to set higher lows since the start of August are all positive signs.
He concluded that the confluence of all these factors makes this current price action “feel similar” to the consolidation seen between May and July, adding that it can “only be considered bullish.”

On-chain data shows BTC is approaching a major support region
Further boosting Bitcoin’s bull case is the massive amount of support that exists throughout the lower-$11,000 region.
Data from the blockchain analytics platform IntoTheBlock shows that its descent may soon start slowing due to this support.
The platform’s “Global In/Out of the Money Around Price” indicator reveals that the price region between $11,300 and $11,700 is filled with buying pressure.
It also shows that selling pressure is mounting between $11,700 and $12,000, but it’s clear skies ahead for BTC once this region is broken through.

Unless sellers garner enough strength to degrade the support that is laced throughout the lower-$11,000 region, the ongoing decline may prove to be fleeting.
Bitcoin Market Data
At the time of press 5:32 am UTC on Aug. 22, 2020, Bitcoin is ranked #1 by market cap and the price is down 2.95% over the past 24 hours. Bitcoin has a market capitalization of $212.57 billion with a 24-hour trading volume of $24.58 billion. Learn more about Bitcoin ›
Crypto Market Summary
At the time of press 5:32 am UTC on Aug. 22, 2020, the total crypto market is valued at at $356.57 billion with a 24-hour volume of $110.23 billion. Bitcoin dominance is currently at 59.65%. Learn more about the crypto market ›


