According to a cryptocurrency market analyst, the current Bitcoin price trend looks similar to when BTC crashed by more than 50 percent in November 2018. In a tweet, Bitcoin Jack said:
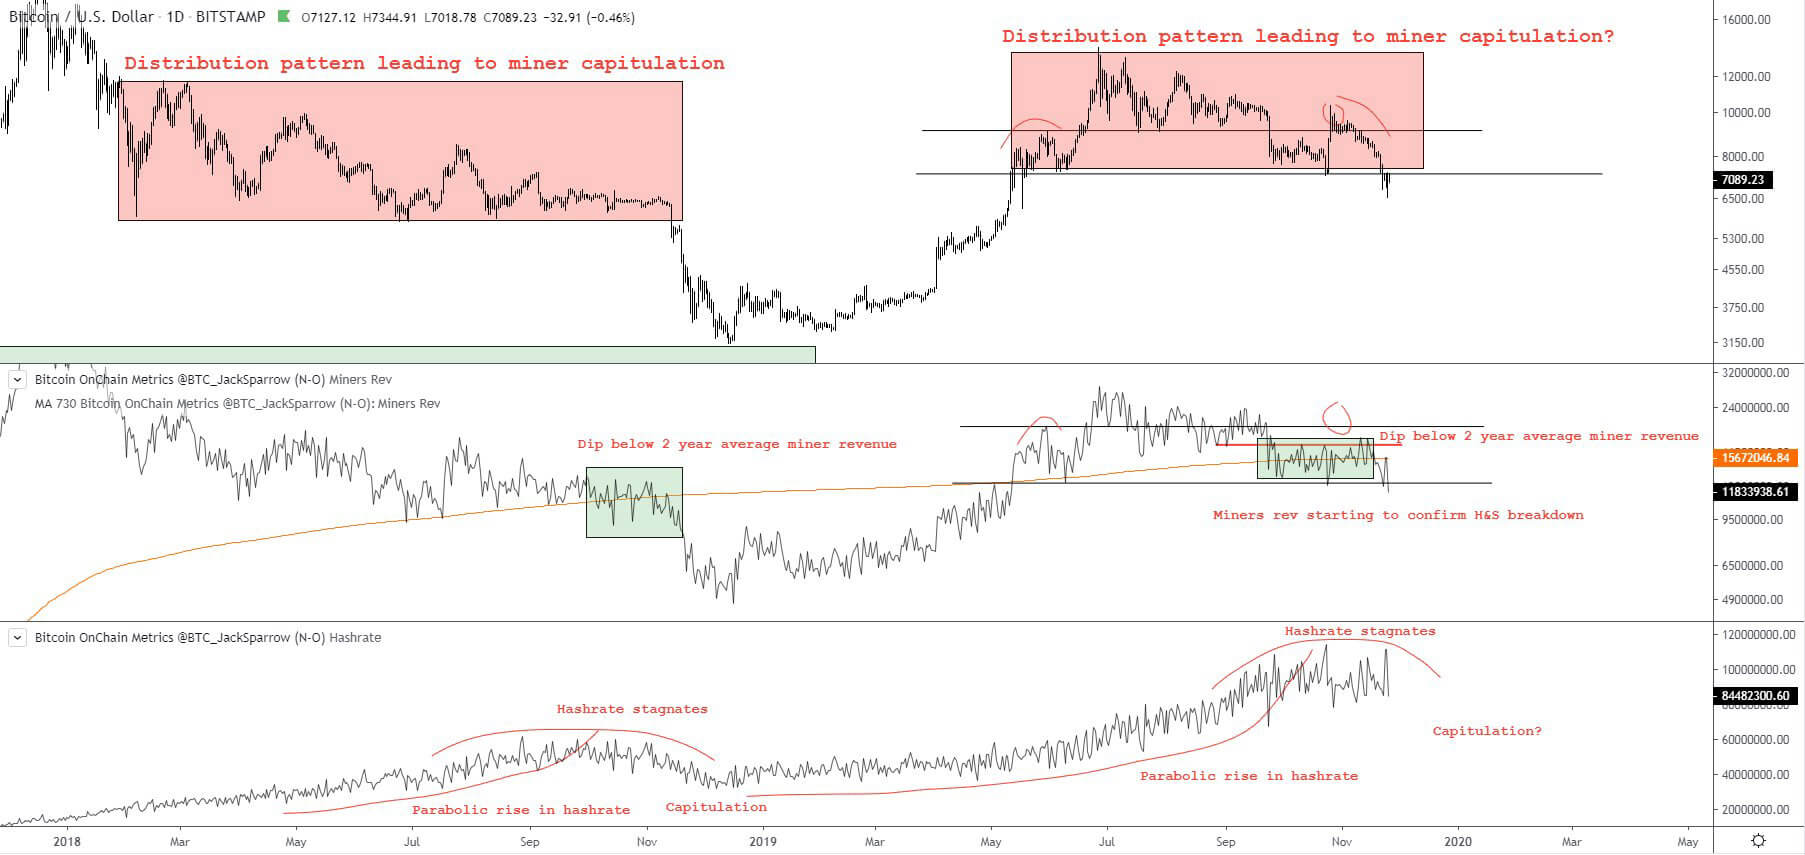
“This is starting too look awkwardly similar to the 6K -> 3K capitulation setup. Possibly too farfetched but can’t deny the similarities”

The analyst compared the drop in the miner revenue, potential stagnation of hash rate, and the fractal that formed before BTC engaged in a steep drop to lower support levels.
The main theory is Bitcoin miner capitulation
Analysts had varying theories to explain the abrupt $3,000-drop of Bitcoin in November 2018.
Some venture capital investors said that as uncertainty around the U.S.-China trade war reached its peak, investors went onto sell more risky assets including cryptocurrencies, contributing to the drop of the asset.
Others suggested that the substantial drop in the price of Bitcoin below the breakeven point of mining led small miners to capitulate, a theory that has been circulating around the sector in recent months.
If the past two months of bearish price action have been a build-up to potential capitulation amongst small miners, there is a possibility that BTC drops much lower than anticipated support levels. The analyst noted that when the Bitcoin price was hovering at $7,100:
“This should start to worry you. Everyday Bitcoin spends below $7300-7900 pressure gets added to this cooker Game theory suggests miners are a target now.”
Although the Bitcoin price demonstrated signs of a short term bullish reversal as it swiftly moved from $6,600 to $7,700 within a span of several days, it was quickly rejected at important resistance levels.
In the past 48 hours, the Bitcoin price has fallen from $7,850 to $7,330, by well over six percent against the U.S. dollar.

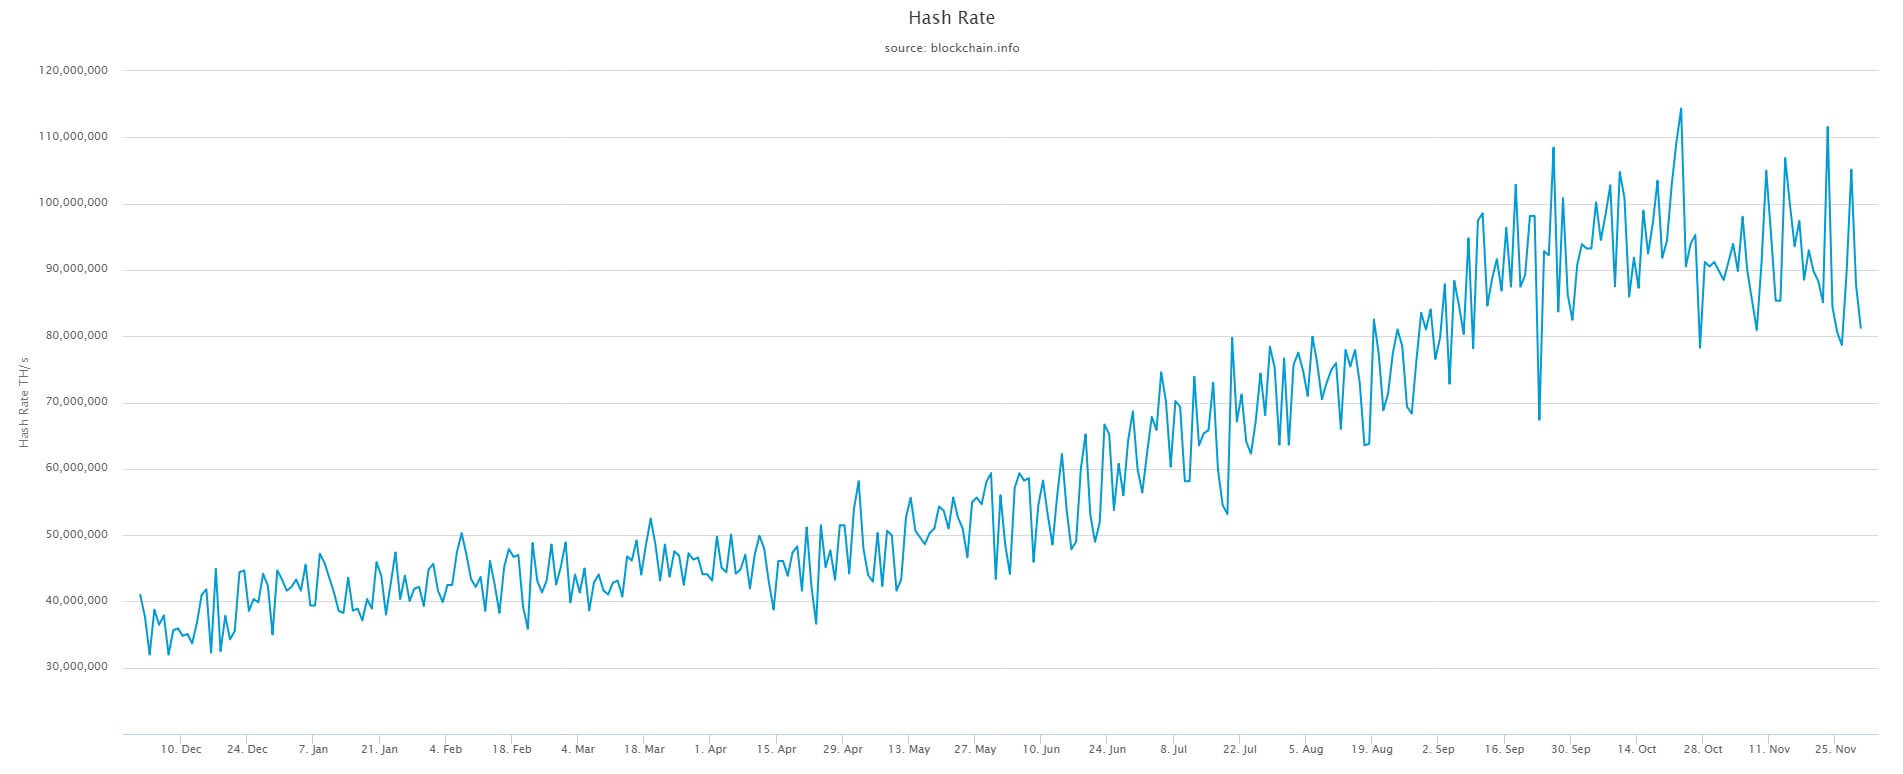
The Bitcoin hash rate has been dropping since October 2019, but due to variance and other factors, it is difficult to determine whether the hash rate is actually on an extended decline.
Is deeper pullback likely for BTC?
According to prominent cryptocurrency trader Josh Rager, the latest downside movement of bitcoin is seemingly becoming a rejection, with higher time frames indicating bearish structure.
Rager stated:
“BTC looks like a reversal with this follow through break down High time frames don’t look great. Traders keep trading and hodlers keeping hodling – if navigating the Bitcoin market were easy everyone would be here. Enjoy the ride and learn along the way.”
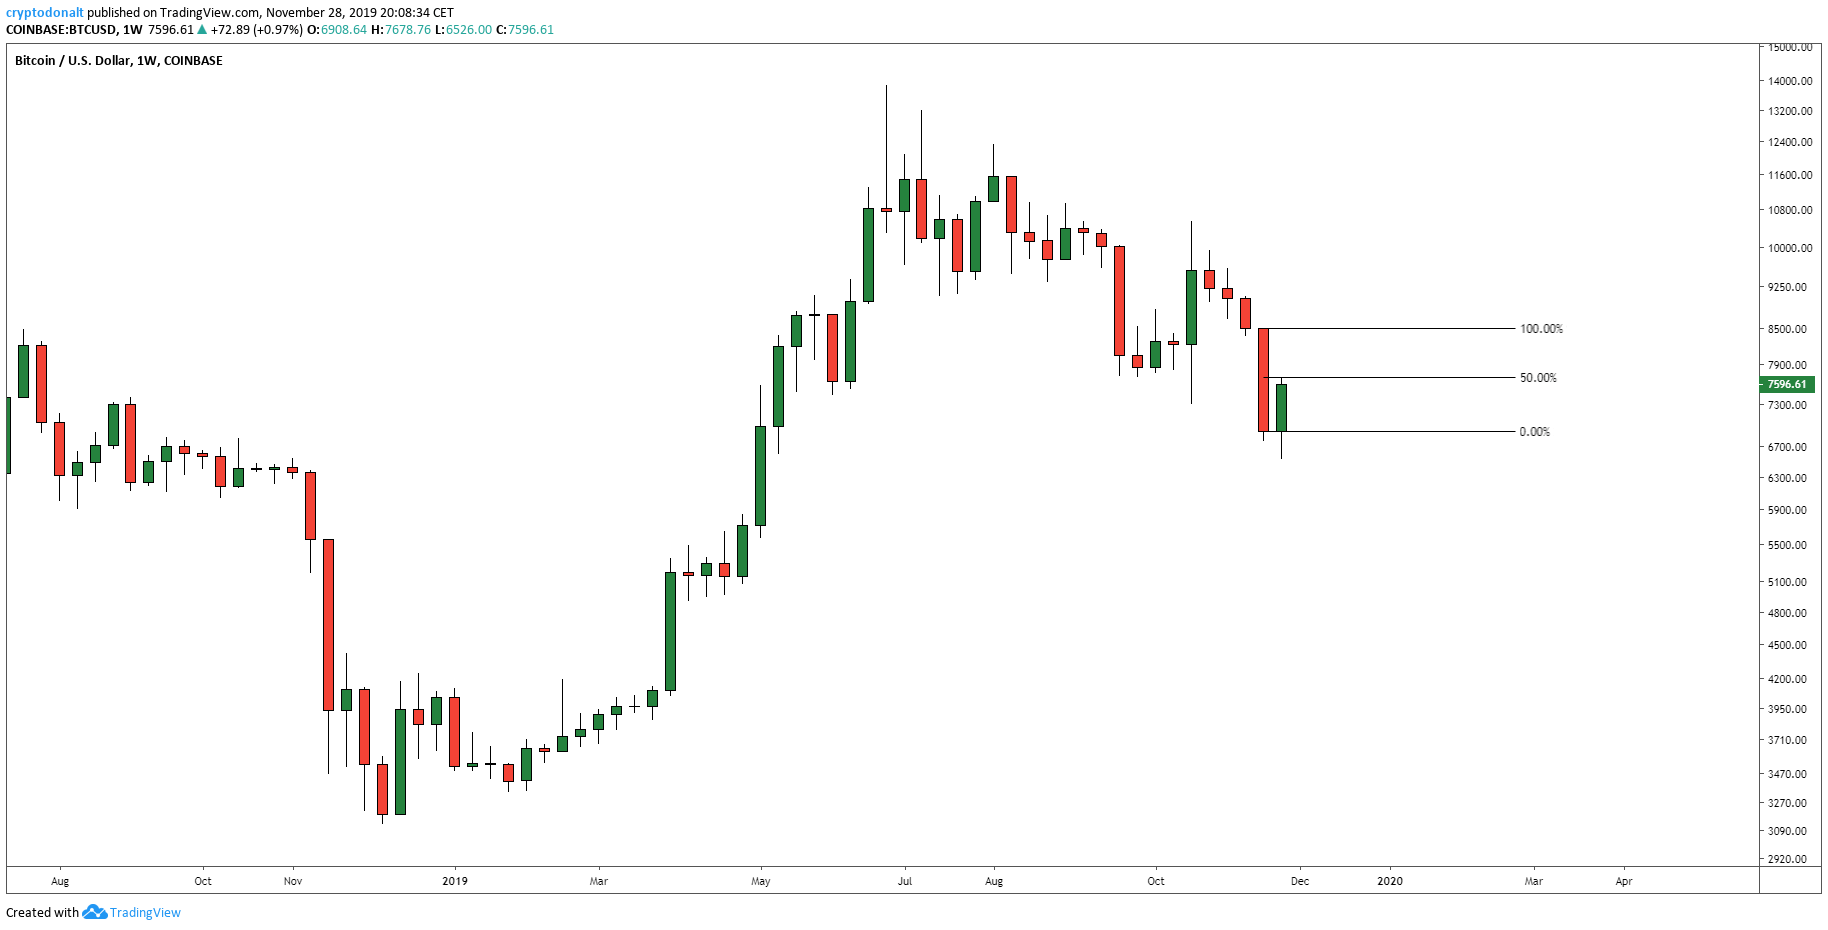
The past six monthly Bitcoin candles on major platforms like BitMEX closed as lower highs, which would normally indicate a bearish macro trend for the asset.
Cryptocurrency trader DonAlt noted on Twitter:
“4 weeks of selling followed by 1 week of bounce isn’t necessarily as bullish as the small timeframes make it out to be. For reference, this green candle “only” reclaimed 50% of the previous one. I’m personally not looking to rush into a long position just yet.”

Bitcoin Market Data
At the time of press 4:09 pm UTC on Dec. 7, 2019, Bitcoin is ranked #1 by market cap and the price is down 3.56% over the past 24 hours. Bitcoin has a market capitalization of $134.17 billion with a 24-hour trading volume of $18.74 billion. Learn more about Bitcoin ›
Crypto Market Summary
At the time of press 4:09 pm UTC on Dec. 7, 2019, the total crypto market is valued at at $201.47 billion with a 24-hour volume of $62.35 billion. Bitcoin dominance is currently at 66.57%. Learn more about the crypto market ›


