Glassnode data analyzed by CryptoSlate showed a divergence between super whales and retail, with the former remaining in aggressive accumulation mode going into the new year.
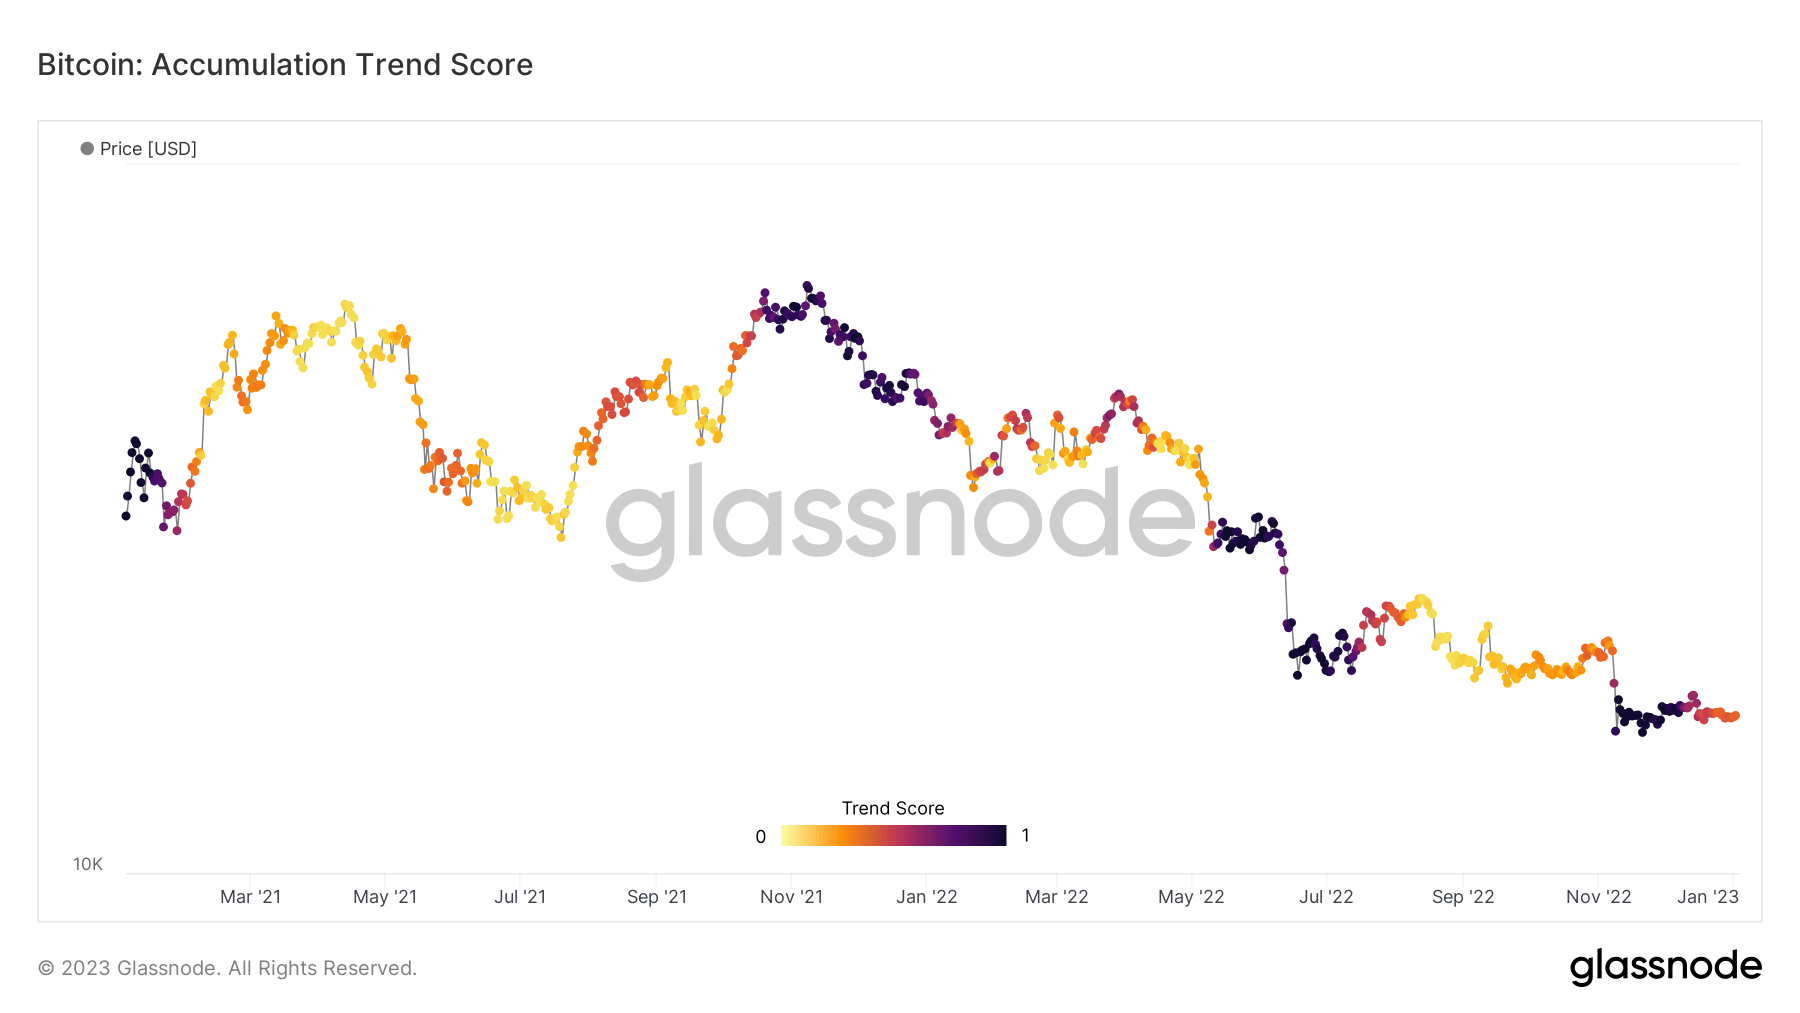
Bitcoin Accumulation Trend Score
The Accumulation Trend Score (ATS) looks at the relative size of entities that are actively accumulating or distributing their Bitcoin holdings.
The ATS metric uses a spectrum between 0 to 1. A reading closer to 0 indicates distribution or selling. While a score closer to 1 shows accumulation or buying.
Analysis of the chart below showed that substantial accumulation happened during the FTX collapse around early November 2022, even as the Bitcoin price reacted negatively to the news.
This suggests that investors, as a whole, saw value in buying at discounted prices.
The ATS has since turned more neutral, with distribution bias, reflecting lingering macro uncertainties going into 2023.

Cohort analysis
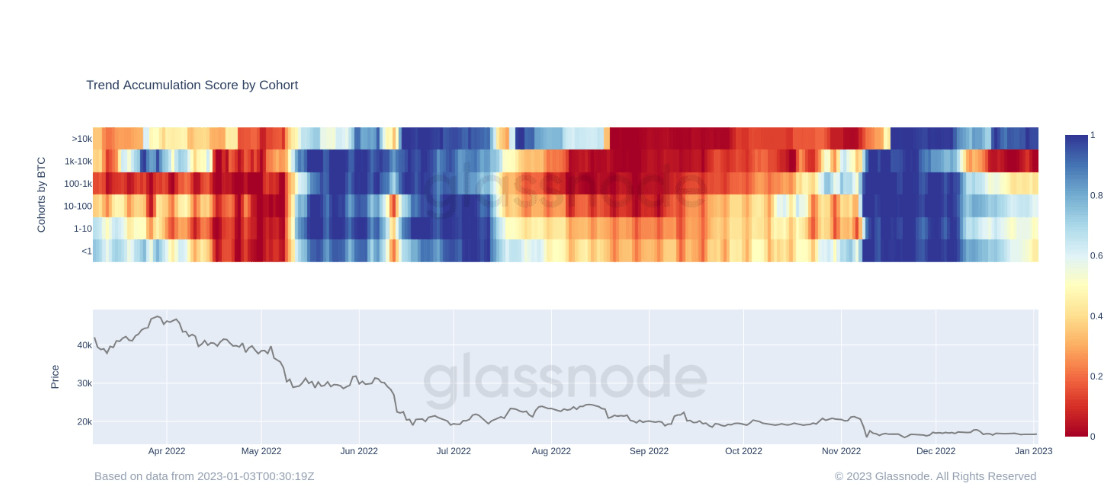
Cohort analysis gives a graphical representation of accumulation and distribution across six cohorts, ranging from minnows with less than one BTC to super whales holding more than 10,000 BTC.
As the FTX saga was blowing up, all cohorts were accumulating aggressively. This consistent trend ended around mid-December 2022 when whales (entities holding between 1,000 and 9,999 BTC) began heavily distributing.
The change in whale sentiment spread across other cohort groups, which also began distributing, but not to the same extent as the whales. Conversely, throughout this period to the present, super whales remained net accumulators to a strong degree.

Mega-Whale Address Count
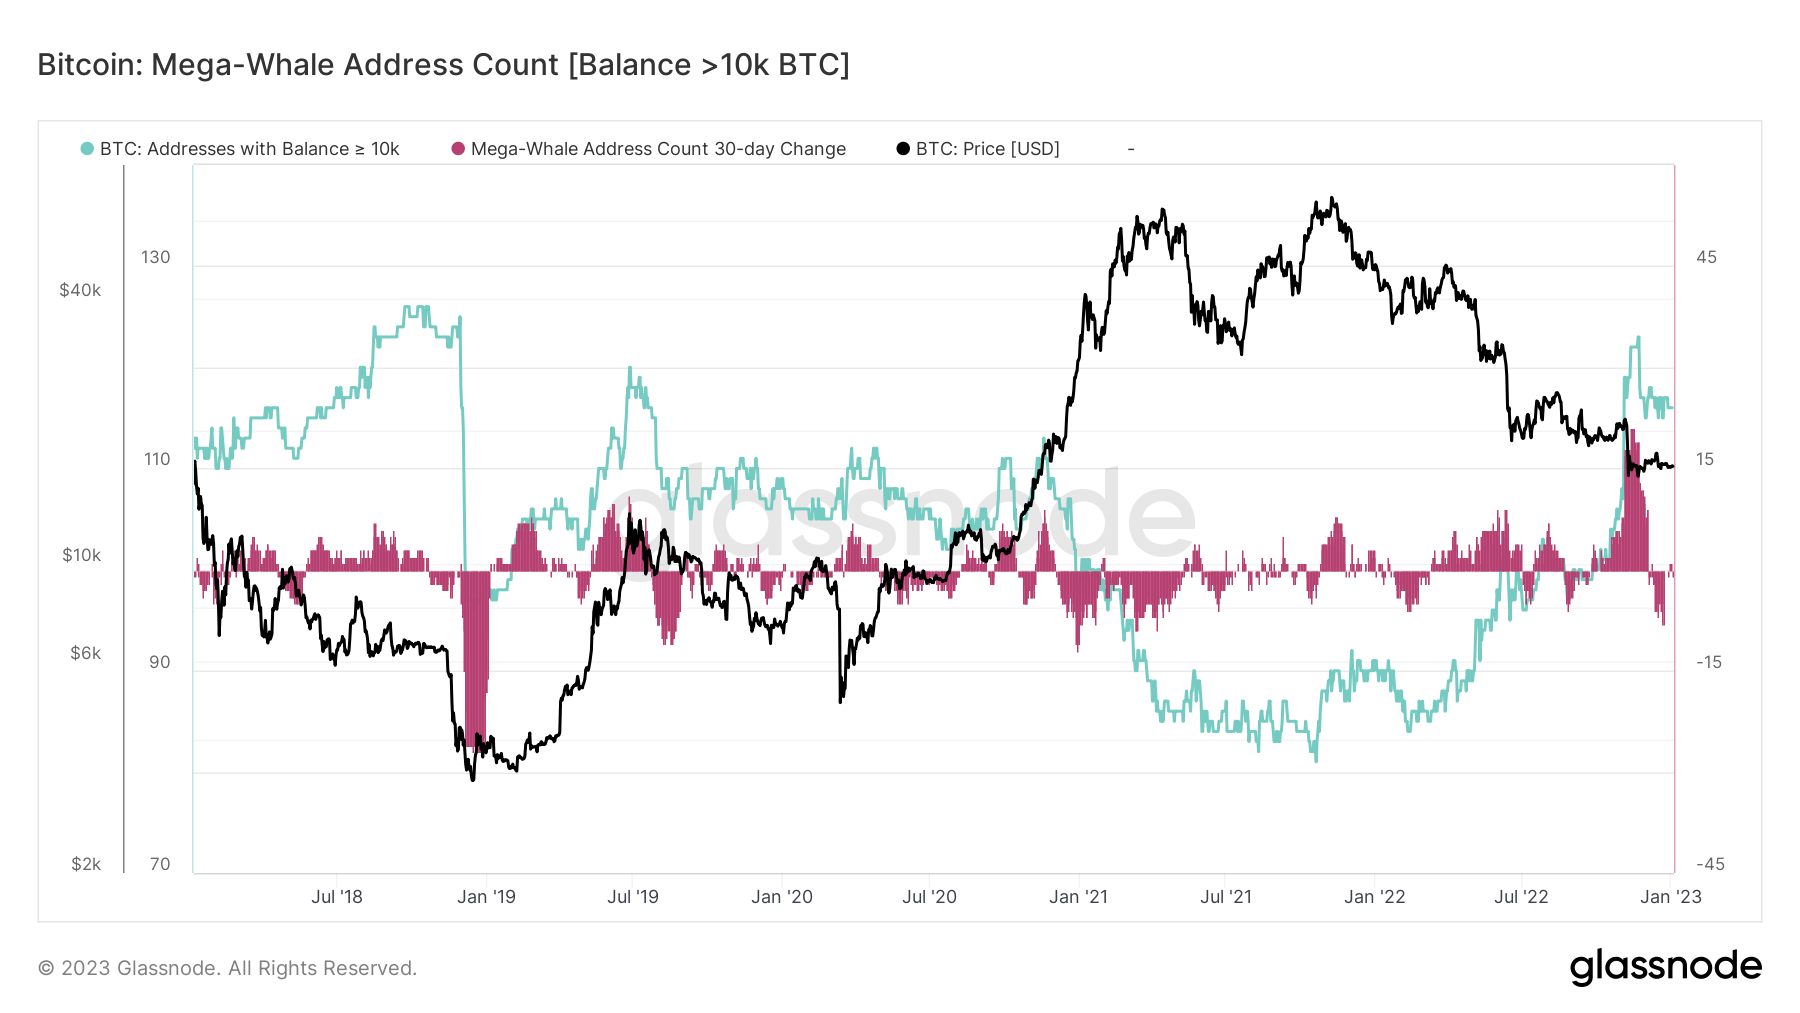
Analysis of the Bitcoin Mega-Whale Address Count Balance showed entities with more than 10,000 BTC surpassed 120 addresses at the tail end of last year. This encompassed a 30-day change of over 20 additional addresses, marking the fastest growth rate since 2018.
Coupled with the above charts detailing aggressive super whale accumulation, it’s fair to conclude smart money investors were buying the dip.


