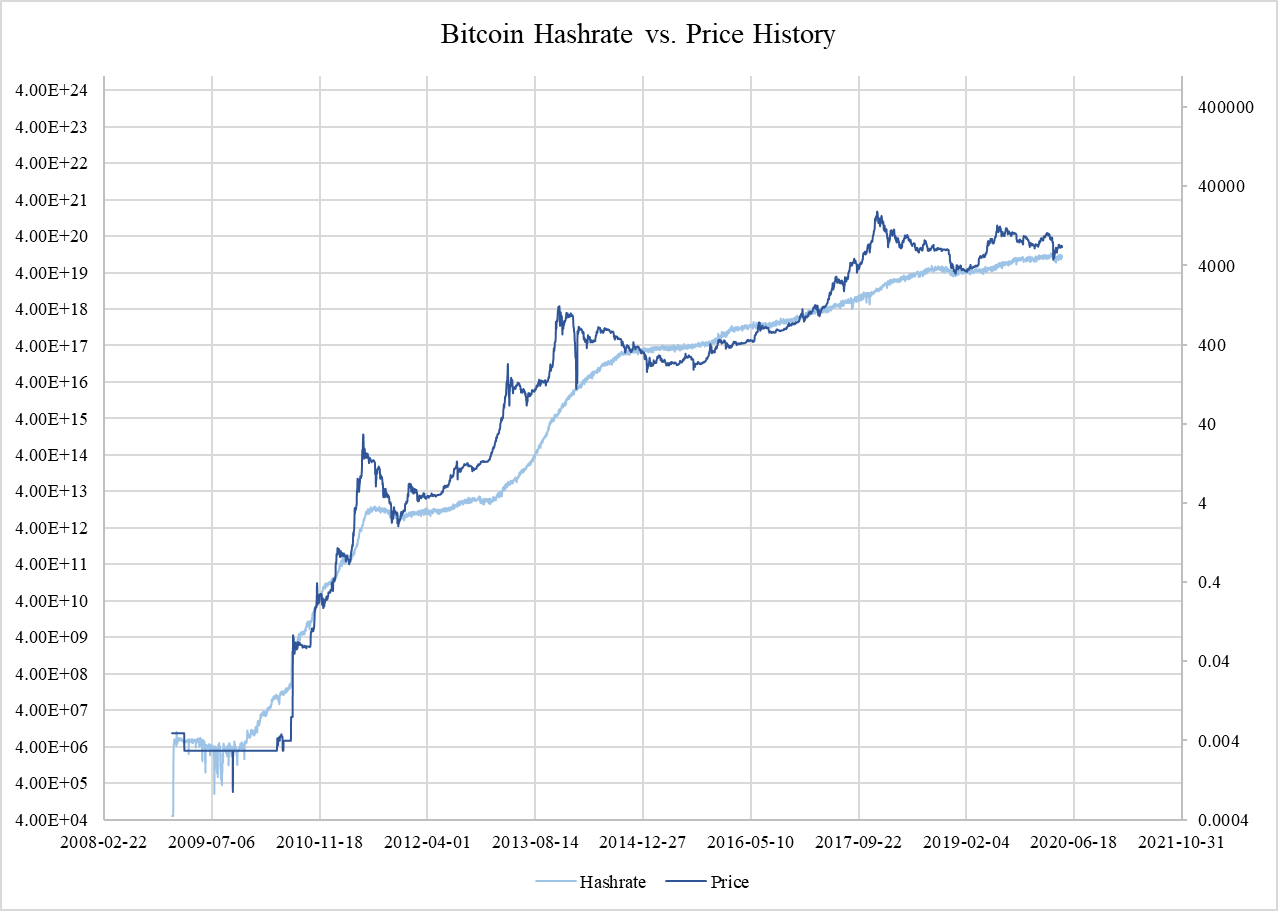
Since its inception in 2009, Bitcoin’s price rise has been controversial across mainstream media. While most publications dismiss the virtual currency as highly volatile and random, certain data sets prove the price movements can be traced to a popular metric.
Using data from Blockchain.com and superimposing price history to check for trends, a Reddit post noted the uncanny similarities between Bitcoin hash rates from 2009 with price movements.

Bitcoin prices largely “revert-to-the-mean” of hashrate data; with eleven major instances of price meeting with logarithmically calculated hashrate values. For the casual retail trader, the observation proves useful — buying bitcoin whenever prices move above hash rate values results precedes massive price spikes in four instances followed by a gradual sell-off.
The correlations mean bitcoin is not as random as popular consensus tends to state. Transaction values, price activity, technical analysis, and fundamental news all lead bitcoin prices, much like traditional markets.
A whole set of analysts on TradingView devote themselves to trading on hash rate data, implying investment ideas on the metric aren’t all that far-fetched.
For the uninitiated, hash rates can be defined as the “buying power” of the Bitcoin network, meaning “hashing” all transactions via complicated, CPU-heavy solving of difficult mathematical puzzles as network activity increases.
Higher hash rates indicate the strength of a blockchain network as well — more miners means better security from 51 percent attacks as more miners (and computing power) would be required to “attack” a blockchain (assuming one or few entities do not control mining).
Bitcoin hashrate is not a holy grail
The correlation, however, isn’t free from criticism. Some Reddit users point out hash rates and prices are a game of chicken-and-egg; price increases create a lot of retail and speculative interest in the cryptocurrency market, with investors looking to make a quick return with no intent of using digital assets in the “real” world.

Besides, Bitcoin’s mining activity and price have scaled exponentially since 2009, indicating a larger sample set be observed before using hash rates as a viable trading approach.
Meanwhile, the hash rate chart is showing signs of flatlining. Bitcoin’s mathematical complexity has grown multifold — over 74 quintillion calculations take place every second – and mining “rewards” are set to decrease to just 6.25 BTC on May 12, 2020.

With increased mining costs and lower rewards, a flatline could mean hash rates reaching a “peak” and stabilizing in the near future, while the price of bitcoin ultimately decouples from hash rate data as a whole.


