Economist Turr Demeester tweeted that it’s “wild” that the St. Louis Fed compiles data for the ratio of eggs to Bitcoin.
Wild… The official website of the US Fed now has a page with the ratio of eggs to bitcoin. 🍳🚀 Link:https://t.co/TzHZIB0wxe pic.twitter.com/WBEMWudajW
— Tuur Demeester (@TuurDemeester) June 6, 2022
Given the unusual nature of the pairing and the fact most don’t use Bitcoin to pay for groceries, this begs the question, why?
The eggs to Bitcoin ratio
The St. Louis Fed already tracks the monthly average price of a dozen large grade A chicken eggs against the dollar.
The chart below shows an uptrend in the dollar price of eggs since 2000. The price peaked in September 2015 at $2.97, leading to a sharp drop over the following few months, before resuming the uptrend after bottom at $1.20 in June 2019.
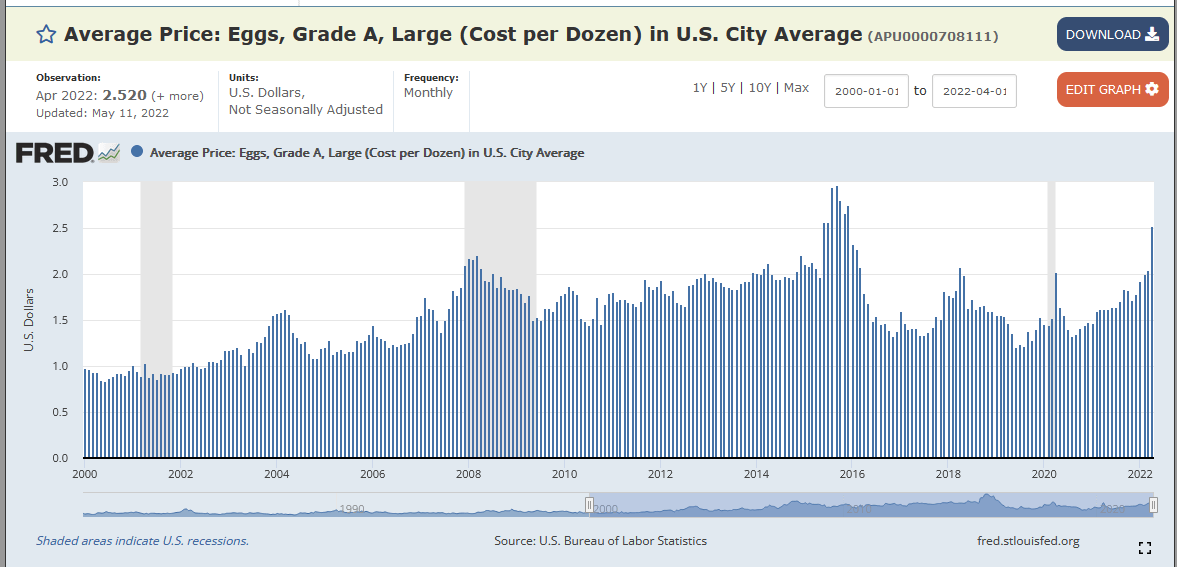
A note accompanying the chart justifies why food (and energy) prices are excluded from “monetary policy analysis,” such as the Consumer Price Index, used to calculate inflation.
“This runny volatility is why food prices, along with energy prices, are often excluded from monetary policy analysis.”
Doing the same but using Bitcoin instead of dollars was a concept “hatched” by the statisticians at the St. Louis Fed.
“Cracking open this first concept is fairly simple, but the FRED Blog team hatched the idea of asking another question: What would the graph look like if we purchased that same carton of eggs with bitcoins instead of U.S. dollars?”
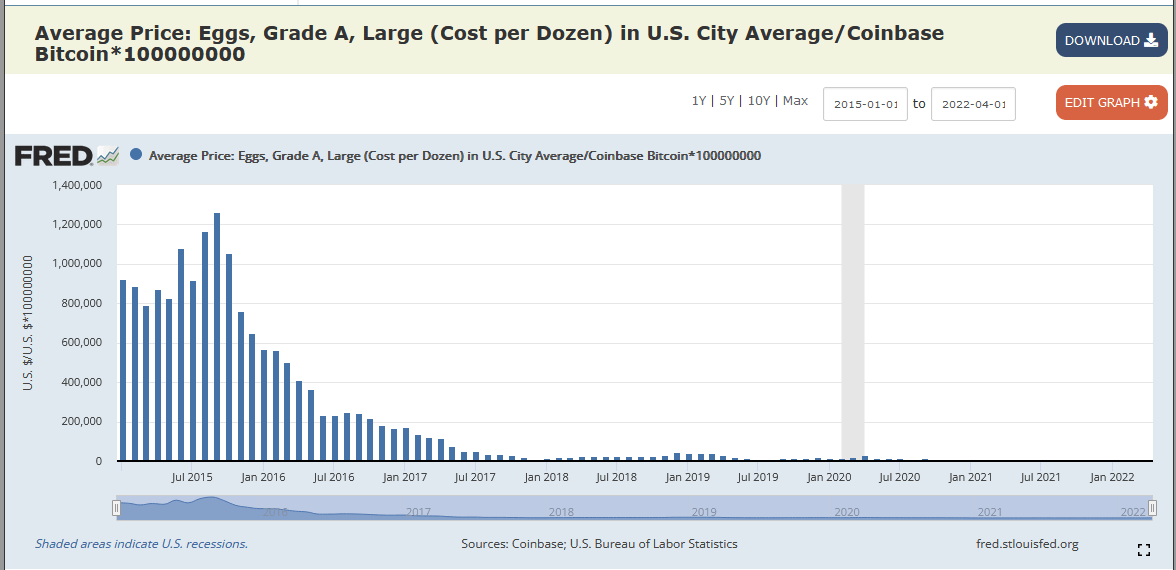
A like-for-like chart from 2000 is unavailable as Bitcoin didn’t come into existence until 2009. In any case, the data held by the organization only goes back to January 2015.
The Bitcoin price of eggs is calculated by the average price of a dozen grade A large eggs divided by the Coinbase Bitcoin price, multiplied by 1,000,000,000, to express the value in satoshis.
Analysis of the data shows a definite downtrend. The BTC price is imperceptible on the chart below from Q4 2019 onwards, which indicates that fewer satoshis are needed to buy a dozen eggs over the longer term. An alternative view is the value of BTC is increasing against the price of a dozen eggs.
The Fed didn’t expect that
Per Demeester, although the ratio of eggs to Bitcoin started as a “diss” to insult Bitcoin volatility, its existence is a nod to its credibility.
“It doesn’t matter that the Eggs/BTC graph was created in order to diss bitcoin’s volatility. What it does is add another notch in the credibility belt of hard digital cash. Bitcoin is here to stay, and nobody in the world can afford to ignore it.”
However, what the St. Louis Fed didn’t bargain for was a comparison of the two variables in the longer term.
The upward trajectory of the dollar chart is in contrast with the Bitcoin chart. Thus providing conclusive data-driven evidence that the purchasing power of BItcoin is increasing over time against a real-world everyday use product.
The same cannot be said about the dollar.


