While Bitcoin is usually considered the backbone of the crypto industry, one should never underestimate the role stablecoins play in the market.
Stablecoins are essentially the fiat currency of the crypto ecosystem and act as the main supplier of liquidity to the market.
When looking at the crypto market as a closed system containing only stablecoins and cryptocurrencies, the supply of stablecoins and their behavior becomes increasingly important. This is especially useful when analyzing Bitcoin’s performance, as the ratio between the two can indicate a potential price rise.
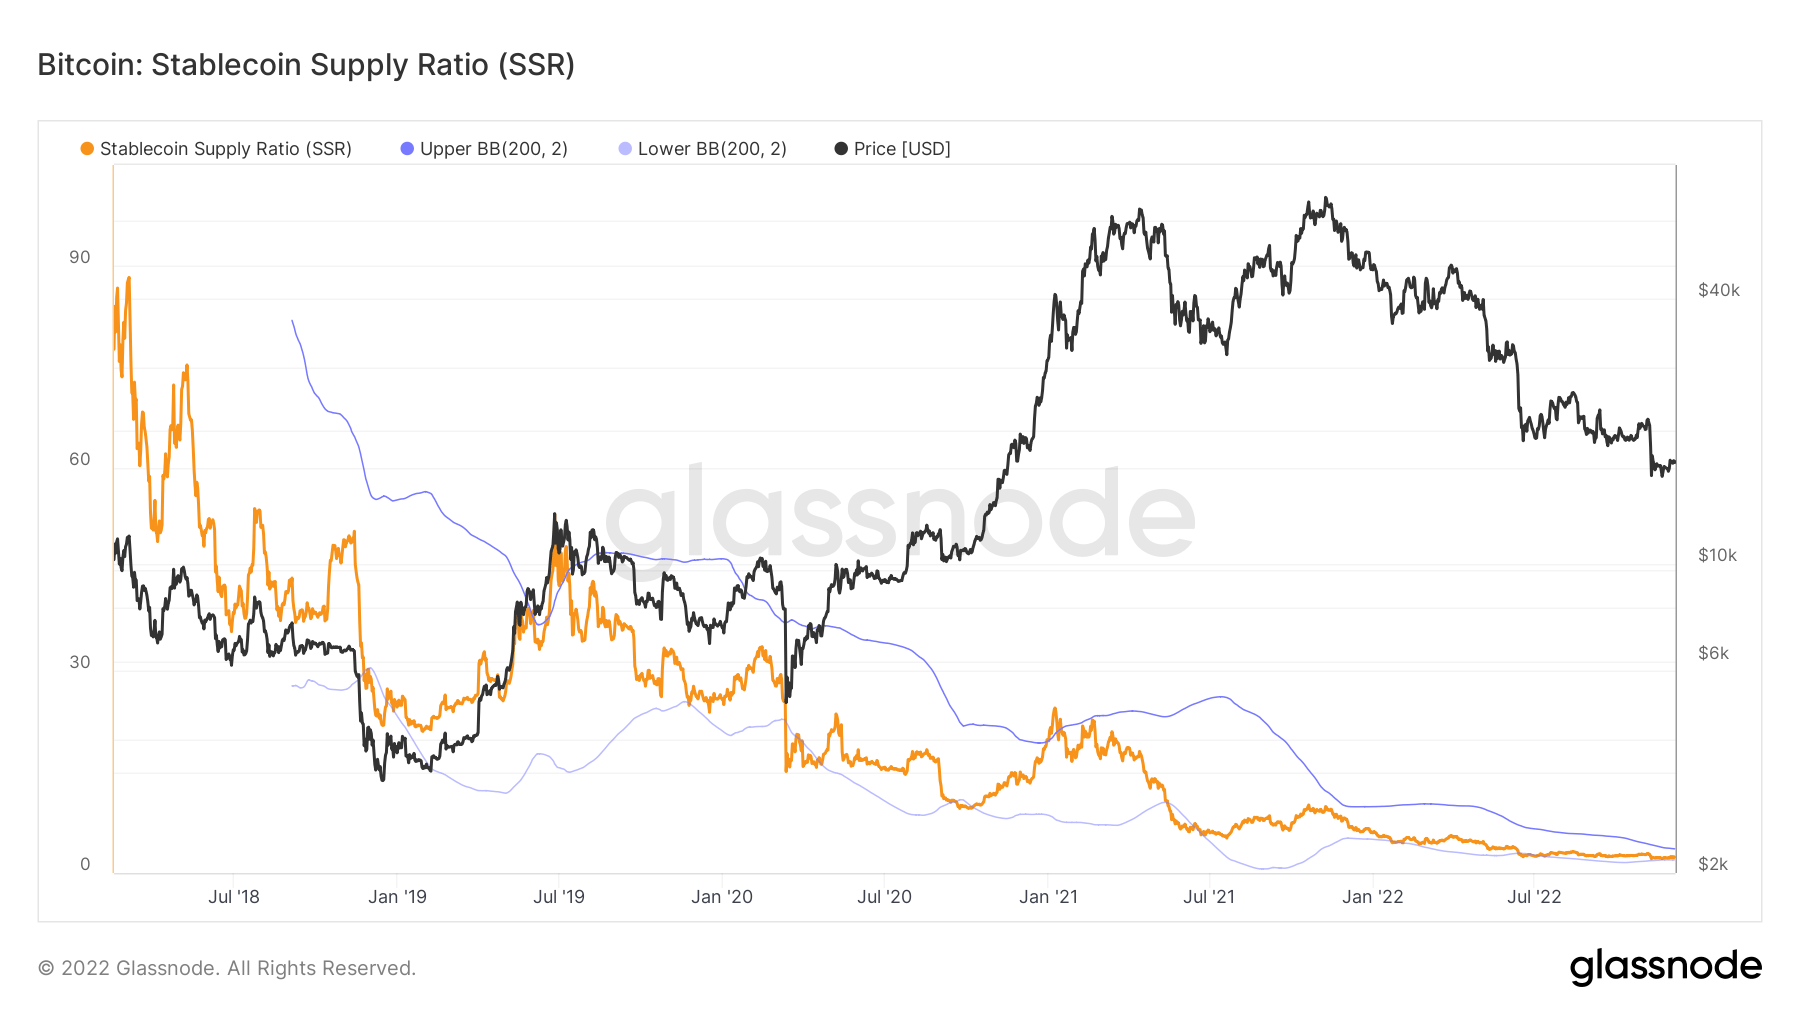
The Stablecoin Supply Ratio (SSR) shows the ratio between Bitcoin’s circulating supply and the supply of stablecoins.
Any movement seen in SSR provides insight into what has more weight on the market — Bitcoin or stablecoins. The ratio essentially compares the power status between the two.
When the SSR is high, it shows that the supply of stablecoins is low when compared to Bitcoin’s market cap. This indicates that there is little buying pressure on the market, as there are fewer stablecoins (i.e. liquidity) to go around. Low buying pressure can indicate that Bitcoin’s price could drop and is considered to be a bearish sign.
A low SSR means that the supply of stablecoins is high when compared to Bitcoin’s market cap. It’s considered a bullish sign as it shows excess liquidity that’s waiting to be deployed into Bitcoin.
Seeing the SSR increase shows that the buying power is slowing down, while a decreasing trend shows the rise in stablecoin buying power.
Data analyzed by CryptoSlate showed that the SSR has been gradually decreasing since the beginning of the year. The ratio has seen two almost vertical drops this year — one following the collapse of Luna, and the other caused by the implosion of FTX.
The ratio currently stands at 2.34, the lowest it has been since 2018.

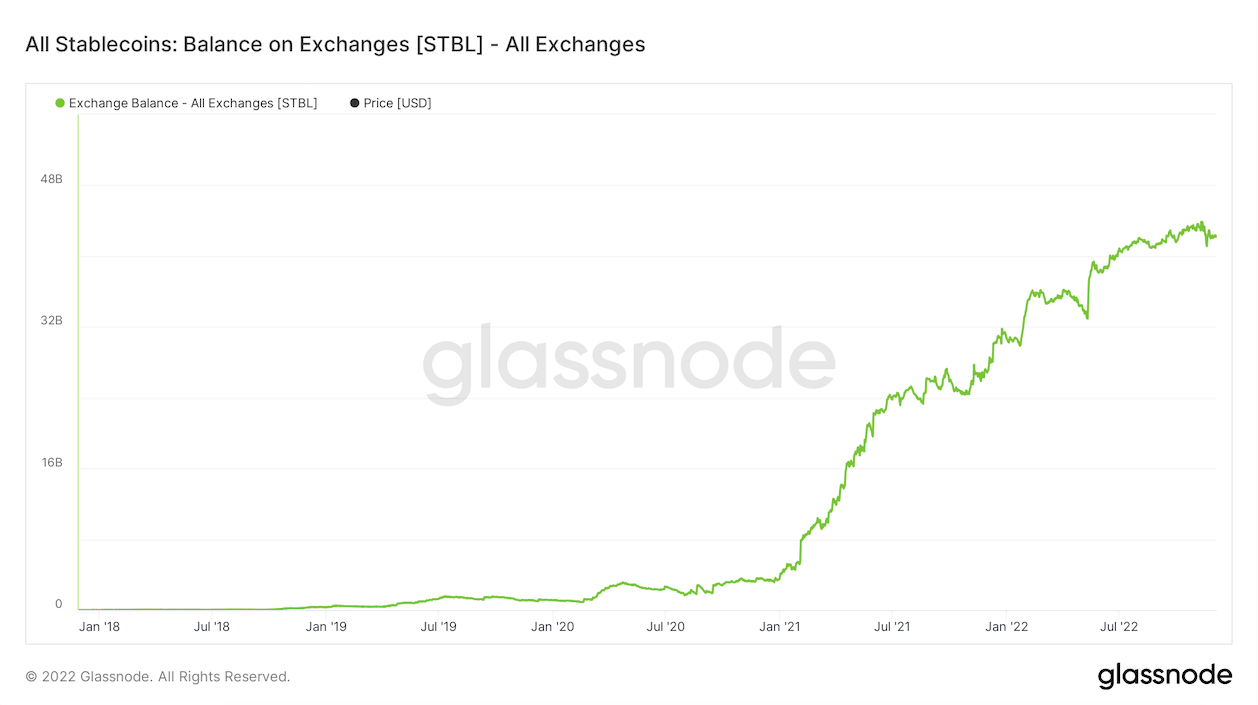
The dropping SSR is further corroborated by the rapidly rising stablecoin balance on exchanges.
Like the SSR, the balance on exchanges shows the amount of “untapped” liquidity sitting on the sidelines of centralized exchanges. According to data from Glassnode, the stablecoin balance on exchanges has grown exponentially since January 2021. And while it saw sharp decreases in the weeks following the Luna collapse and the aftermath of FTX, its growing trend has continued throughout the year.

As of December 6, over $42 billion worth of stablecoins is sitting on centralized exchanges. This indicates that there is around $42 billion in liquidity on the sidelines of the market, ready to be deployed into cryptocurrencies like Bitcoin.


