The 2020 U.S. presidential election had the largest polling error in 40 years. How reliable are the current numbers indicating that Kamala Harris and Donald Trump are in the closest race in decades? We provide guidance on interpreting individual, tracking, and state polls.
By Professor Will Jennings, Sky Elections Analyst
Most party strategists, U.S. pollsters, and political commentators will tell you that the 2024 presidential election could be the closest in decades, possibly even in a century.
Considering that Joe Biden’s 2020 victory was secured by fewer than 45,000 votes across three key battleground states, this is a bold assertion.
However, that’s precisely what the polls are showing. The race between Kamala Harris and Donald Trump is razor-thin, both nationwide and in key battleground states.
So, can we really trust these polls?
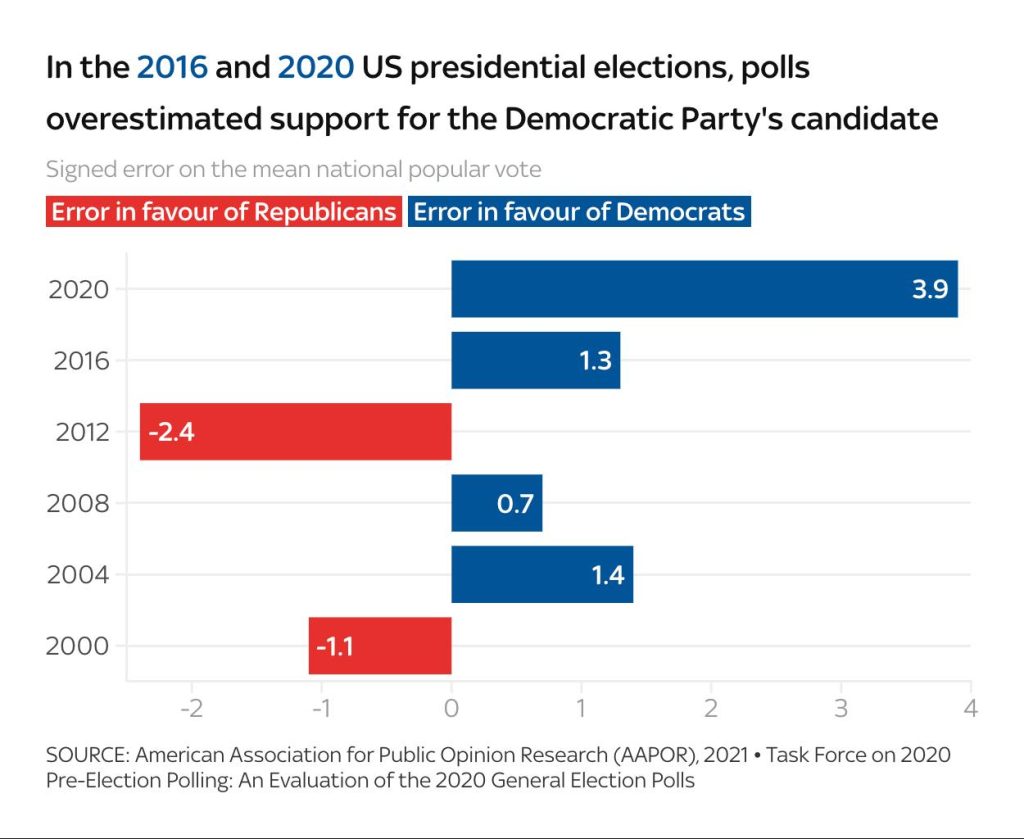
This question has been widely asked, especially after the major missteps in polling from four years ago. The American Association for Public Opinion Research described it as the biggest polling error in 40 years, with Biden’s lead over Trump in the final weeks of the campaign appearing twice as large as it actually was when the votes were tallied.
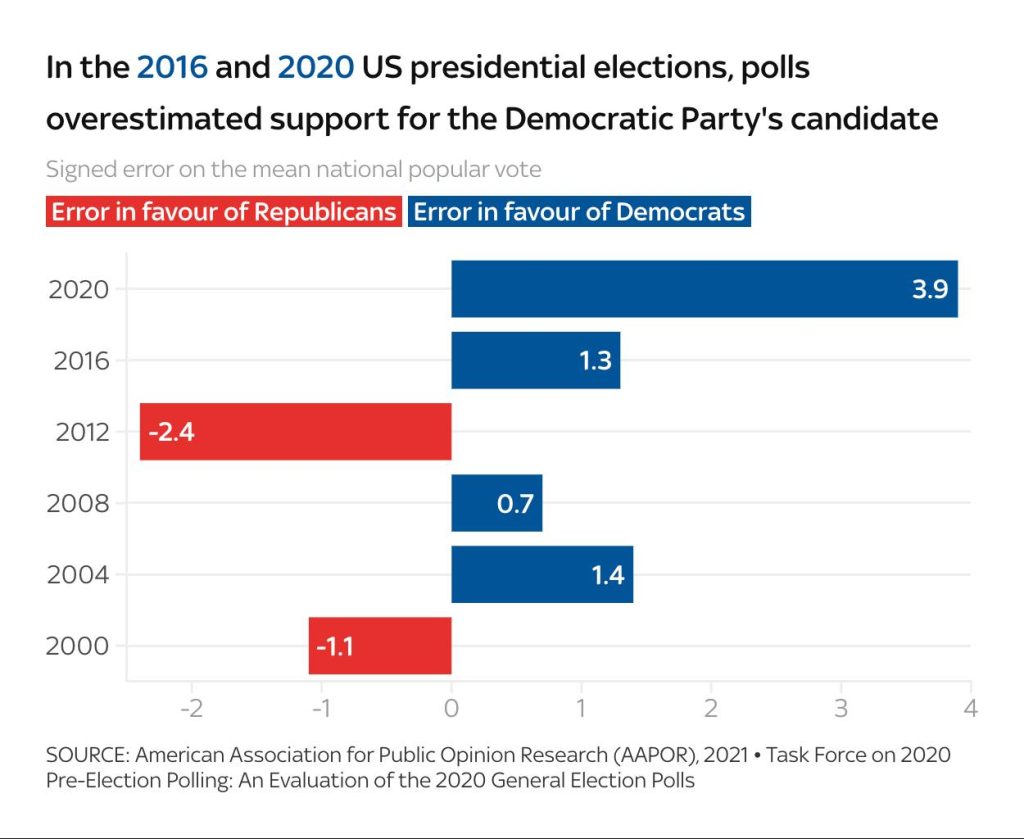
In 2012, pollsters greatly underestimated Barack Obama’s lead over Mitt Romney. However, while Donald Trump’s 2016 win over Hillary Clinton surprised many, the margin of error in the national polls was relatively minor in comparison.
Naturally, all polls carry some degree of uncertainty and built-in error, providing only a snapshot of the present moment rather than a forecast of the election day outcome.
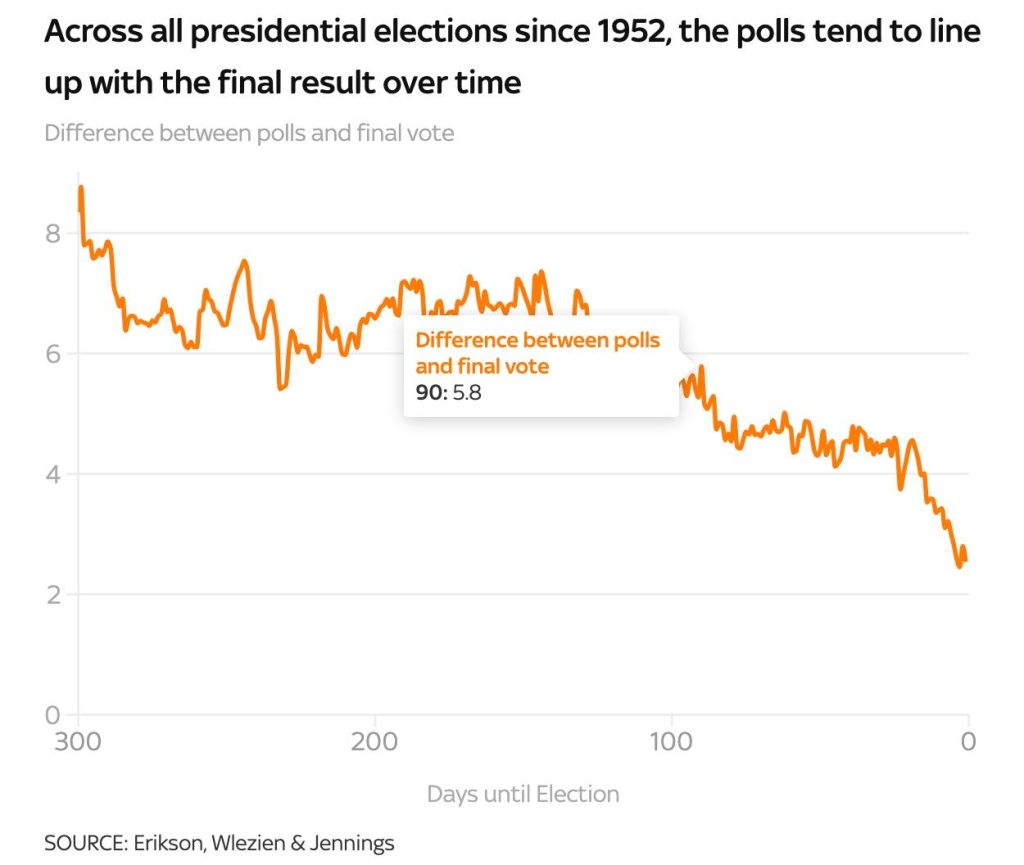
However, there’s key evidence suggesting that polls become more accurate as the election draws nearer. While it might seem intuitive, polls taken a year before the vote typically differ by about seven points from the final result for each candidate. In the final week of the campaign, this gap narrows to less than three points.
With each passing day, the polls offer a clearer picture of the likely outcome.
So, how should we interpret the polls?
One important point to keep in mind is the uncertainty surrounding the estimated support for each candidate.
Understanding Uncertainty: The ‘Margin of Error’
Pollsters provide percentage figures for candidate support, but they also include a ‘margin of error’ to account for possible variation.
For instance, if a poll shows Mr. Trump with 46% support and a margin of error of three percentage points, his actual support could range from 43% to 49%. If Ms. Harris is shown at 49% in the same poll, her support might fall between 46% and 52%.
This only tells us that the race is tight, and either candidate could be ahead.
We must also apply similar caution when interpreting polling averages from trackers. While it might seem that averaging multiple polls would reduce uncertainty – since random errors can cancel each other out – some pollsters are more reliable than others. In fact, some may have consistent biases in one direction, and averaging their results can amplify those biases.

Predicting Voter Turnout: The Importance of Context
Voter turnout is a critical factor in determining election outcomes, but it’s notoriously difficult for pollsters to predict. Around a third of eligible Americans typically do not vote in presidential elections, and this group changes from one election to the next.
Context plays a key role. Certain issues can drive voter engagement, making some more likely to cast their ballots. For example, debates over potential changes to abortion laws motivated many Democrats to vote in the 2022 midterm elections.
A candidate’s policies and performance can also influence how likely partisan voters are to turn out.
The Electoral College: Why State Races Are Key
These factors are just as important – if not more so – when analyzing state polls. State-level contests are often decisive in determining who wins the presidency.
The outcome of the election is determined by the Electoral College, which allocates votes state by state. The gap between the national popular vote and the Electoral College result has been widening in recent elections.
In both 2000 and 2016, the candidate who won the national popular vote still lost the election because they failed to secure the right combination of states needed to win the Electoral College.
This is why battleground state polls receive so much attention and are a crucial component of the models’ statisticians use to predict election outcomes.
However, state polls come with the same uncertainties and potential inaccuracies as national polls. Unfortunately, their recent track record hasn’t been encouraging. In 2016, polls suggested Hillary Clinton would comfortably win the key states required for an Electoral College victory. By 2020, the state polls performed even worse.
Certain states have been especially challenging to poll accurately. In both 2016 and 2020, the largest polling errors occurred in Wisconsin, Michigan, North Carolina, and Pennsylvania.
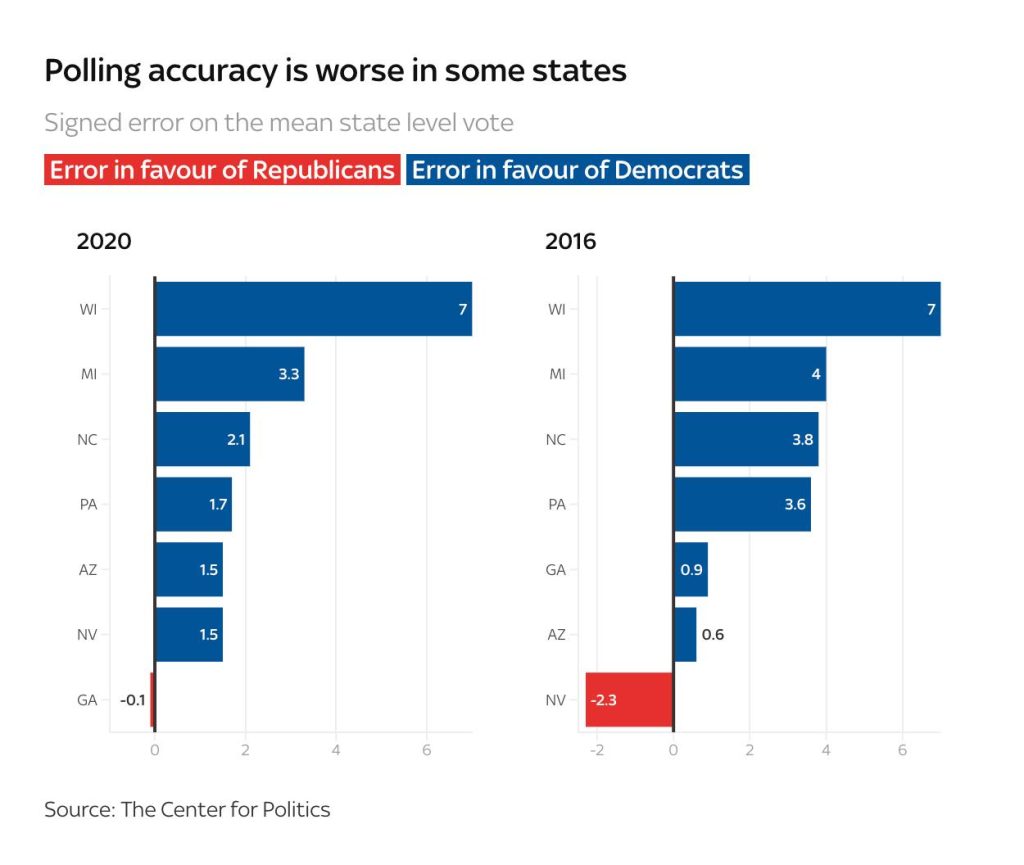
These states – particularly Pennsylvania, which has the most Electoral College votes in the group – could be pivotal in 2024.
So, what insights can the polls provide?
Polls offer valuable information about public sentiment toward a candidate or policy. However, if you’re trying to determine who’s leading in the presidential race, the most you can confidently say is that the contest is extremely tight and could ultimately be decided by a small margin of votes in a handful of states.


