The collapse of FTX might have wrecked the industry and wiped out billions from the market, but it does not seem to have shaken people’s convictions in Bitcoin. The fact that BTC has been struggling to break $16,000 over the weekend turned out to be a major buying opportunity for a big chunk of the market.
This positive sentiment isn’t anecdotal — on-chain data shows clear signs of increased adoption that defies the bear market.
Addresses holding BTC at an all-time high
CryptoSlate analysis showed healthy network adoption. Characterized by an uptick in daily active users, a higher transaction throughput, and an increased demand for block space, growing network adoption has historically been a bullish sign.
One of the best measurements of network adoption is the number of non-zero balance addresses. Growth in the number of addresses holding BTC indicates a larger degree of on-chain activity taking place on the network. A reduction in the number of non-zero balance addresses usually indicates consolidation, as wallets begin purging their assets.
Data from Glassnode has shown a significant increase in the number of non-zero balance addresses on the Bitcoin network. The net address growth began in mid-October and then skyrocketed as November began. This growth was followed by an equally sharp increase in the number of non-zero balance addresses, as indicated in the graph below.
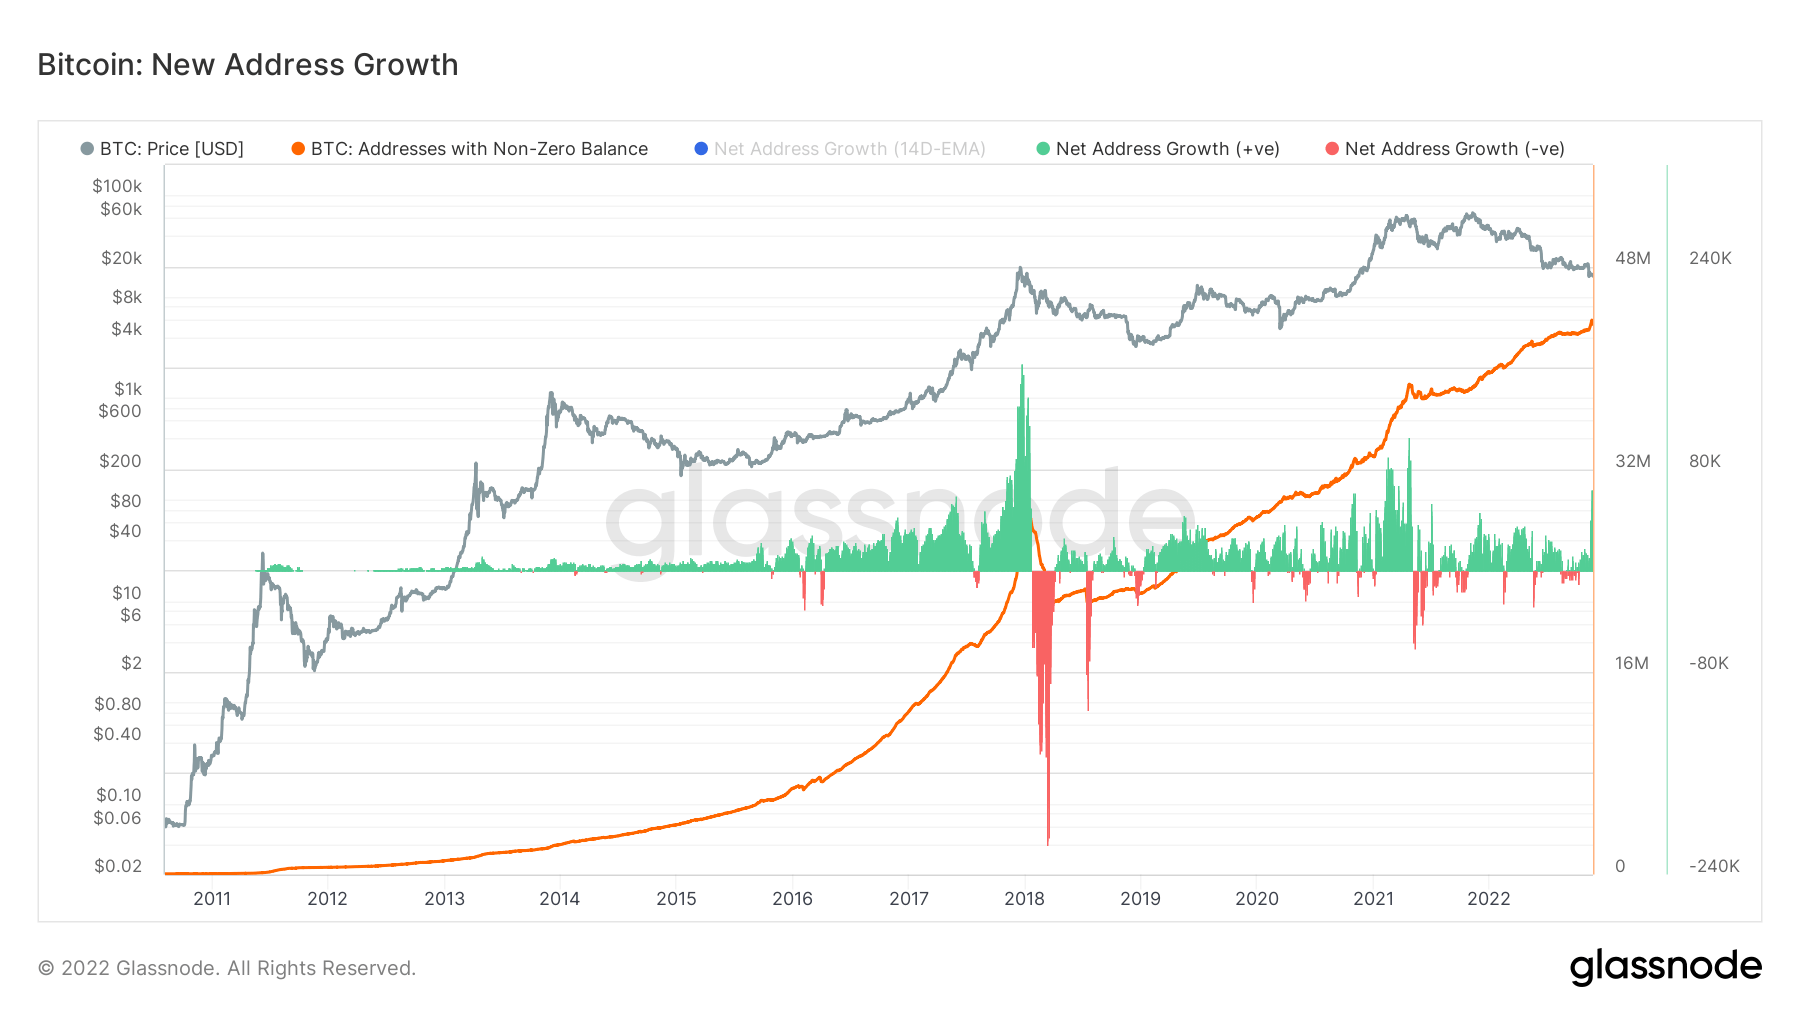
Digging deeper into on-chain data shows that the majority of non-zero addresses were created in the past month. The 30-day simple moving average (SMA) of new addresses surpassed the 365-day SMA, which has been flatlining for the better part of 2022.
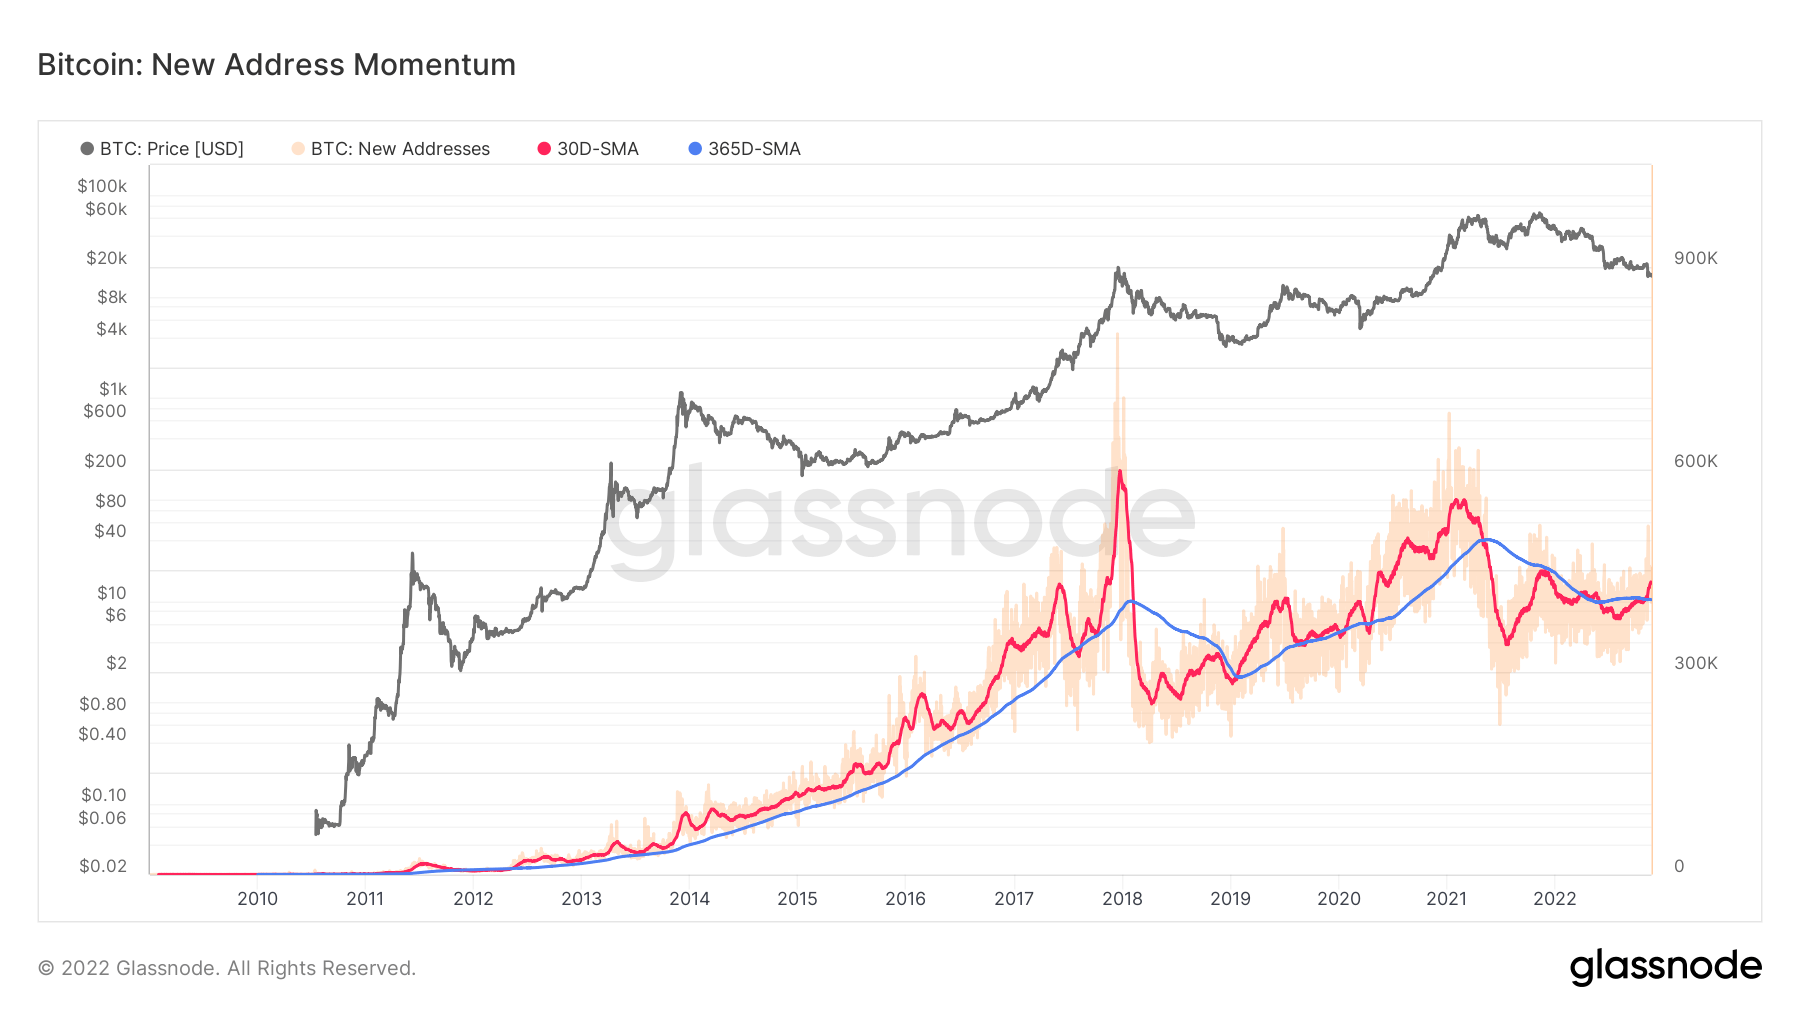
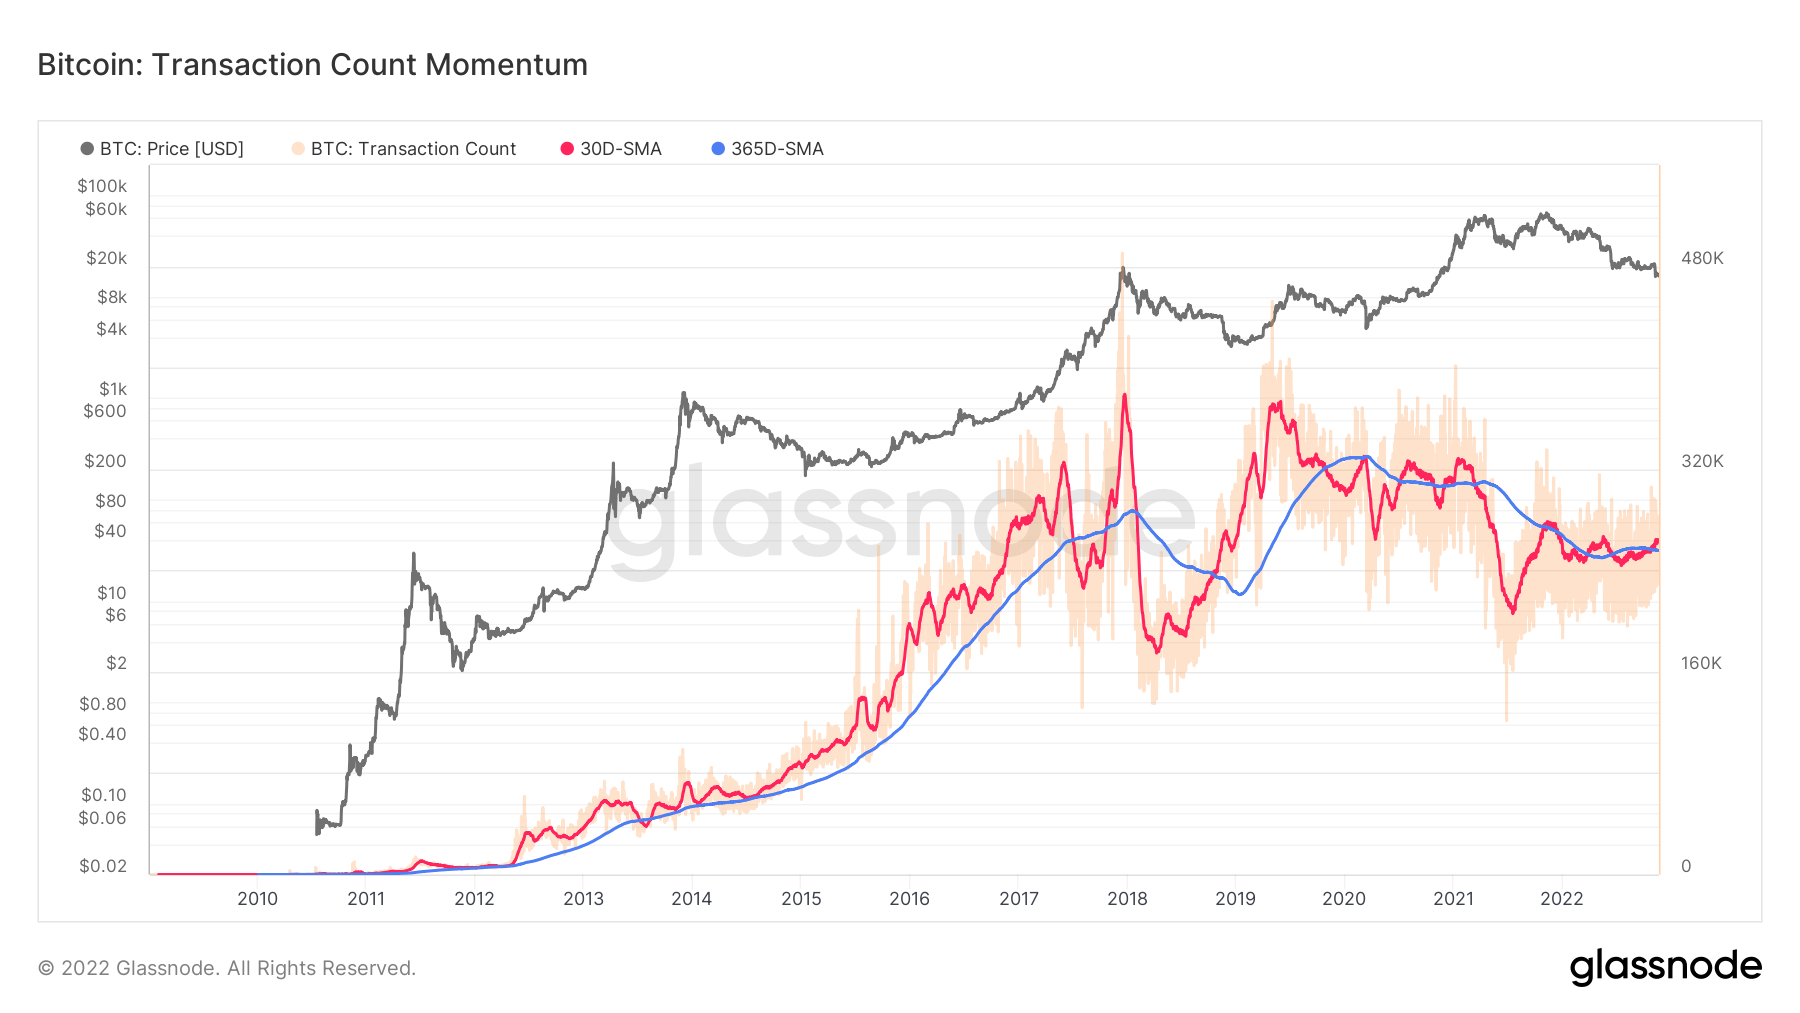
The growth in the number of new addresses translates into a higher transaction count. All of the new non-zero balance addresses had to acquire that balance in the past month, drastically increasing the transaction count recorded on the network.
Bitcoin on exchanges reaches a promising low
The accumulation trend is also evident in exchange data.
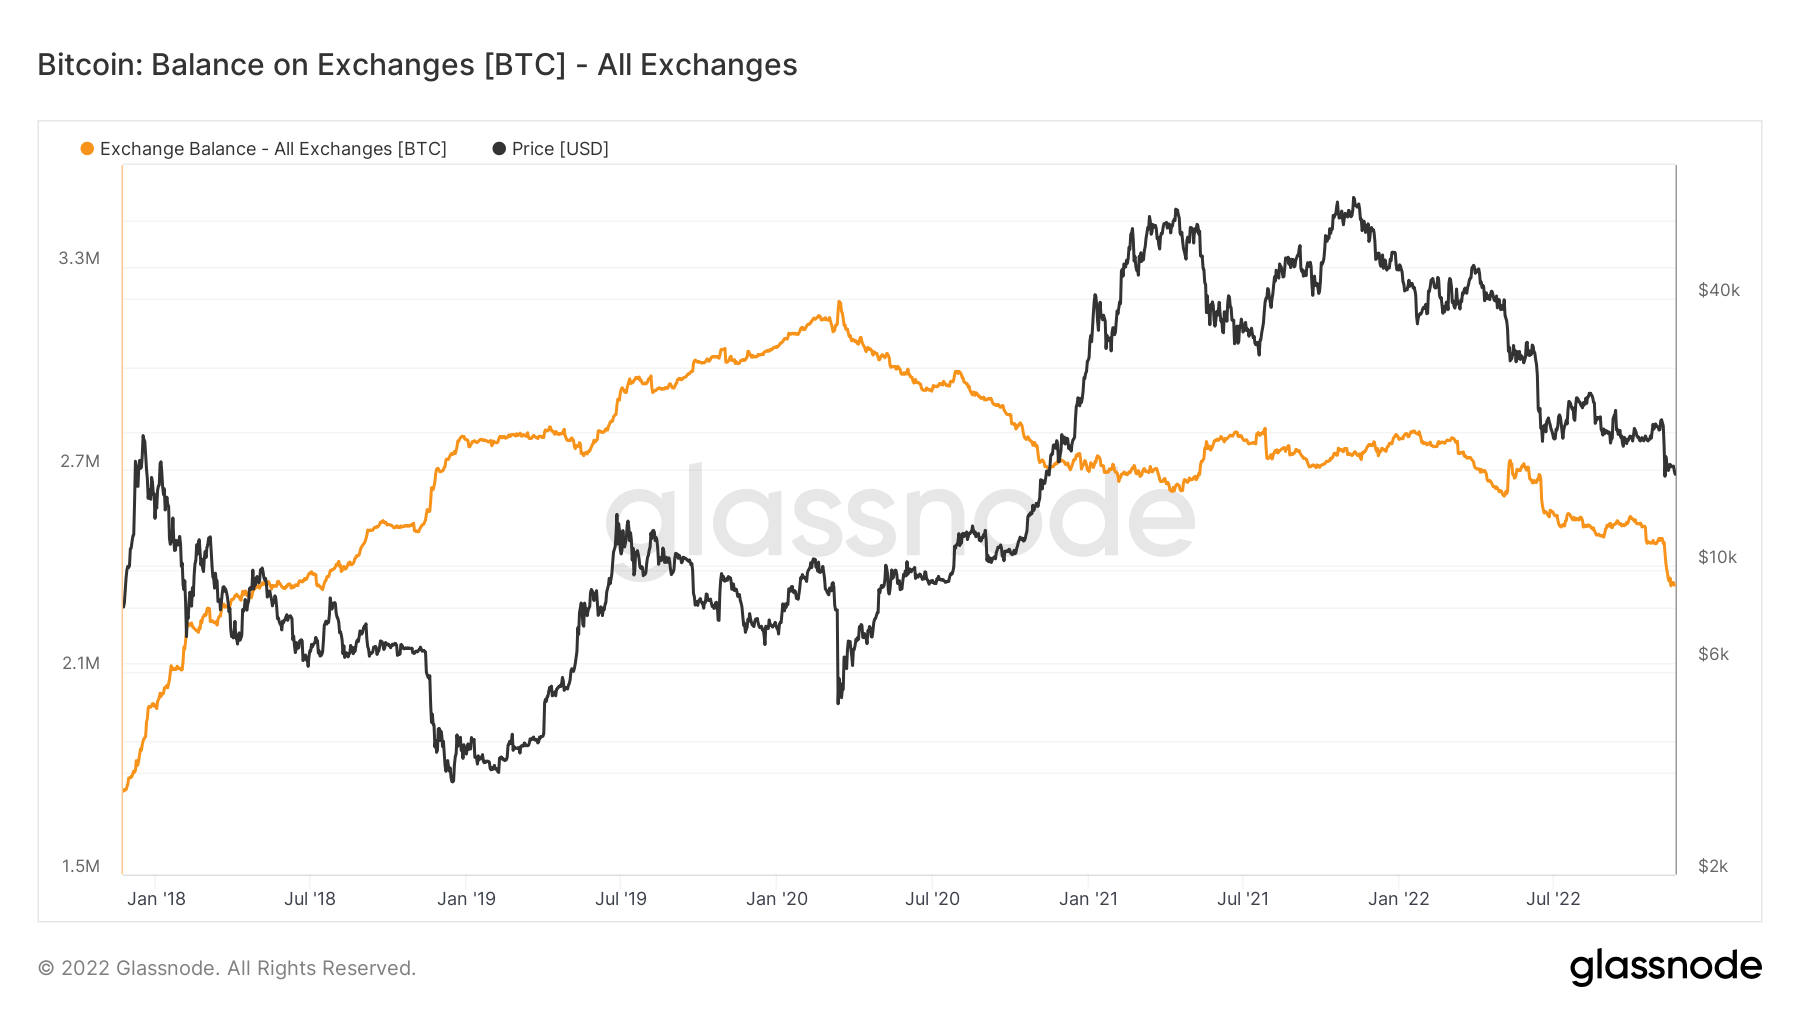
The collapse of FTX has briefly ignited Bitcoin spot volumes across exchanges. However, Bitcoin balance on exchanges began dropping alongside the increasing volume, showing that users have been buying coins en masse and taking them off centralized exchanges and into cold wallets.
Around 2.3 million BTC is currently held on centralized exchanges, similar to the levels recorded in mid-2018. It’s a sharp drop from the all-time high of 3.1 million BTC recorded in 2020.
Gemini saw the most aggressive Bitcoin outflow, losing around 47,000 BTC in a week. The Bitcoin balance held on the exchange dropped from 210,000 BTC last week to around 163,000 BTC.
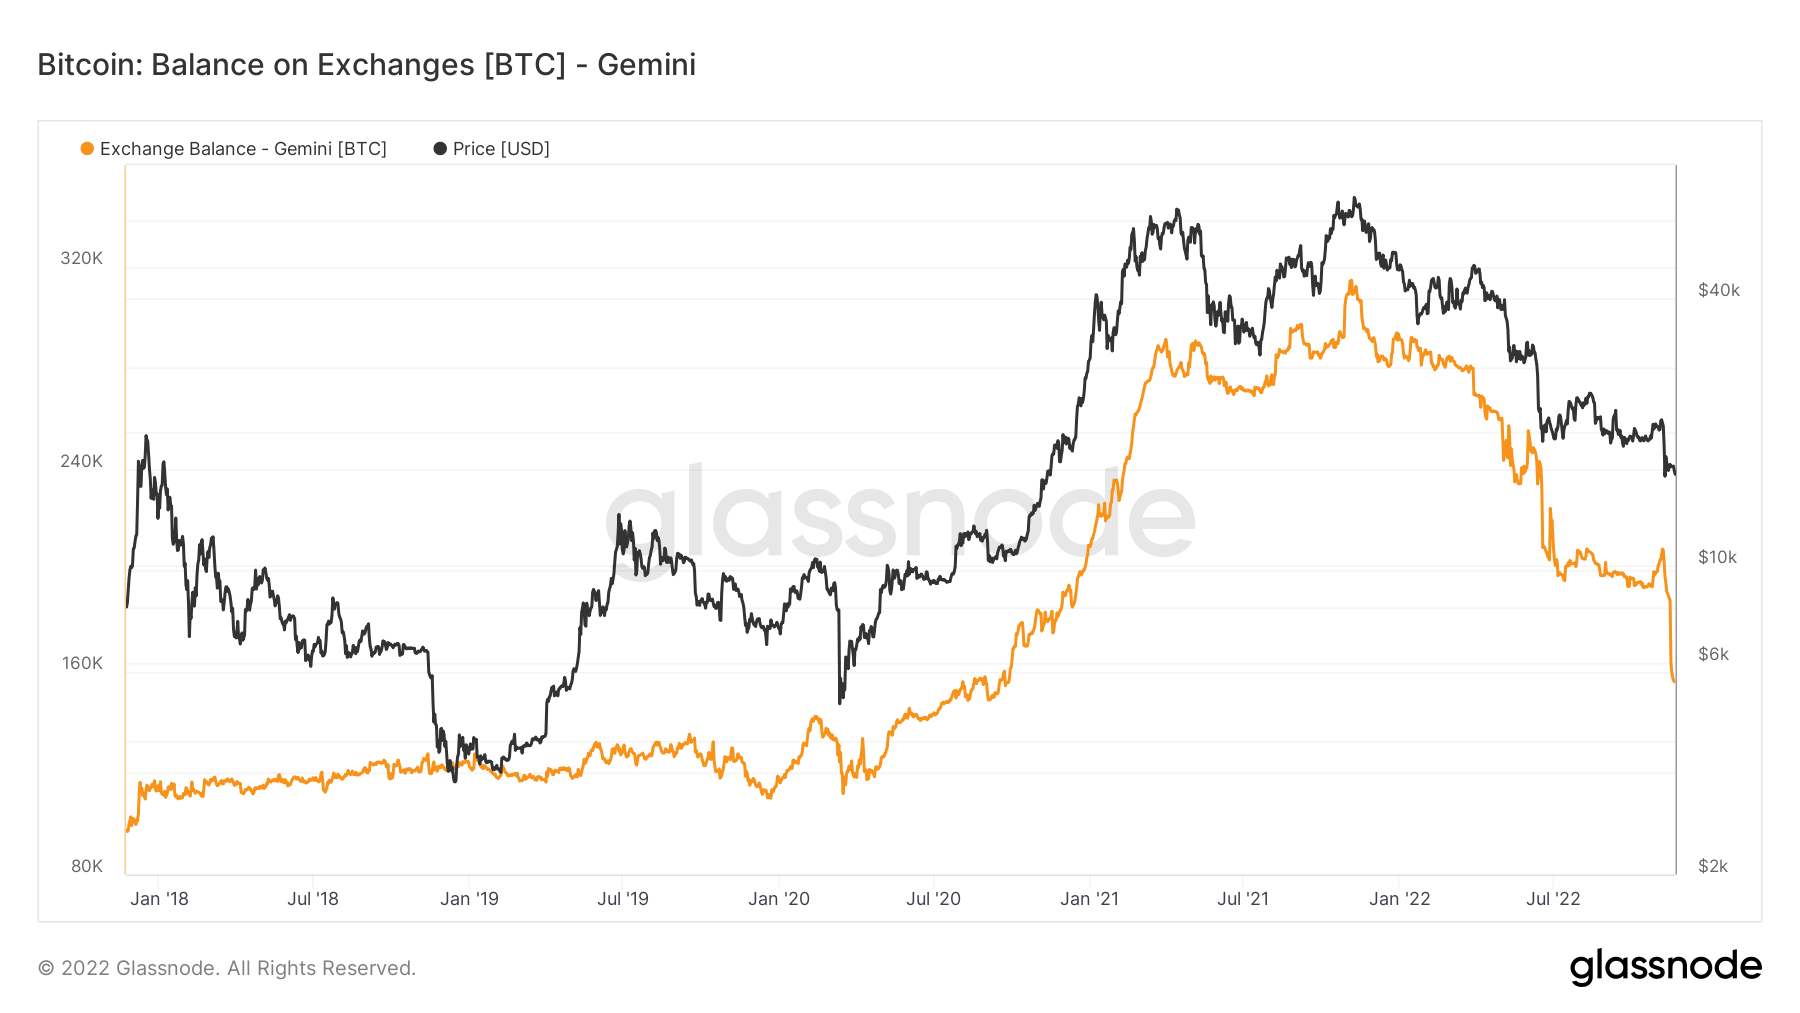
Data shows that only around 12% of Bitcoin’s circulating supply is currently held on exchanges. This percentage further confirms the accumulation trend other on-chain data suggest. And while it might take a while before we see a bullish momentum, the ongoing accumulation shows that the conviction in Bitcoin remains high.


