Bitcoin’s recent rally may simply be a fleeting dead cat bounce that is ultimately followed by significantly further downside – a grim theory that is supported by multiple top cryptocurrency analysts.
The benchmark digital asset is currently caught within a bout of sideways trading that comes close on the heels of its recent rally to highs of $6,900 – which is around where it met significant resistance that halted its uptrend dead in its tracks.
It now appears that BTC’s recent bearishness has done such significant damage to its market structure that it could soon plummet by 50 percent or more, with two top traders laying out a compelling case for why further blood may be imminent.

Bitcoin struggles to hold key technical level as bulls and bears reach an impasse
At the time of writing, Bitcoin is trading up marginally at its current price of $6,200, which is around where it has been trading at over the past day.
This bout of consolidation comes close on the heels of its recent rally from $5,000 to $6,900, which was a sharp movement that led many analysts to begin flipping bullish on the crypto.
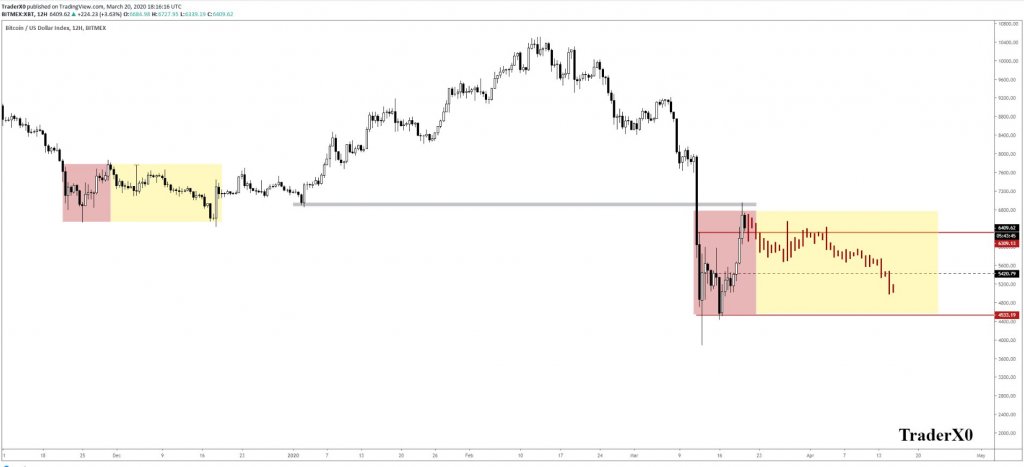
In spite of this, TraderXO – a well-respected cryptocurrency analyst and trader on Twitter who has amassed a large following – explained that Bitcoin’s 200-day moving average is a key level to watch in the near-term, with this technical level existing just a hair beneath BTC’s current price.
“BTC Few charts flying around pointing straight to 9k. Here is one scenario I’m looking at – Targeting 6k, then 5.5 and possible we retest 4’s. The key for me is if price can hold at the weekly 200MA if we were to retest the level.”

This top trader is forecasting that BTC will see some massive downside
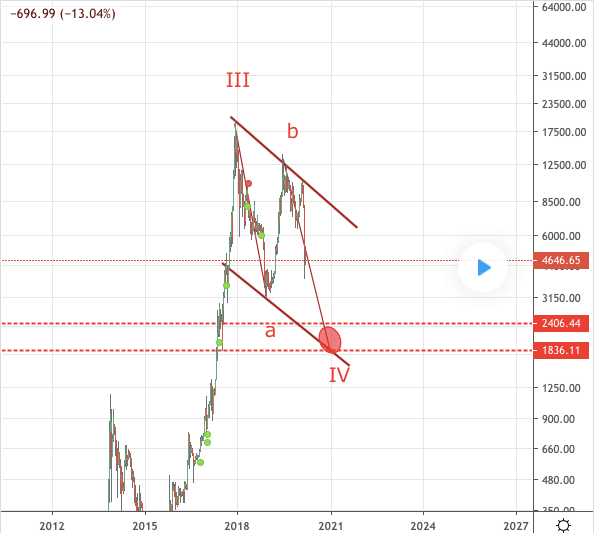
Although TraderXO seems to think that Bitcoin’s near-term downside target could exist within the $4,000 region, Pentarh Udi – a top cryptocurrency trader on TradingView who has been lauded by many prominent Bitcoin investors – offered a chart showing that BTC could soon dip as low as sub-$2,000 by the end of the year.

While looking at the analysis outlined on Udi’s above chart, it does appear that Bitcoin is beginning to form a descending channel formation on a macro time frame, which may guide its price lower in the days and weeks ahead.
It is important to note that he does explain that this bearish scenario could be easily invalidated if Bitcoin propels above the upper boundary of this channel, which is currently around $10,000.


